Fig. 9
Download original image
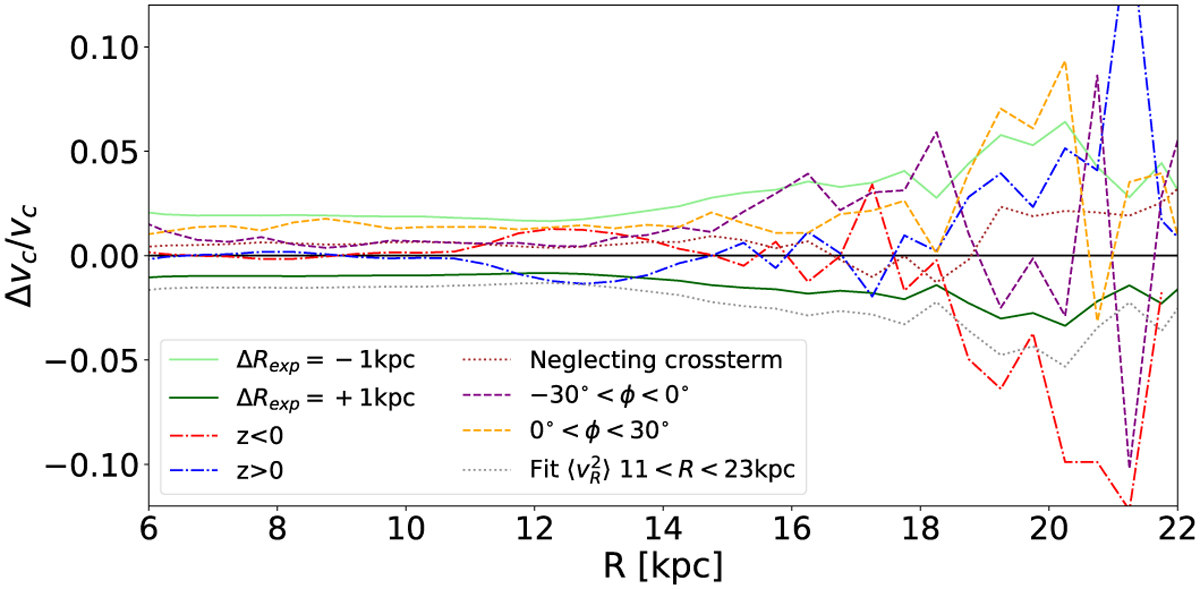
Systematic uncertainties when using Jeans equations to calculate υc. Lines show the difference between different selections or methods and the fiducial BJ model. The light green (dark green) solid line shows the systematic shift when changing the exponential scale length of the number density by −1 kpc (1 kpc). The red (blue) dash-dotted line shows the variation expected considering samples below (above) the disc, selecting ɀ < 0 (ɀ > 0) only. The red dotted line shows the influence of the crossterm in Eq. (6). The dashed purple and orange lines show Δυc/υc for samples for which −30 < ϕ < 0° and 0 < ϕ < 30° respectively. The dotted grey line shows the influence of trying to fit ![]() to its behaviour in the outskirts, resulting in
to its behaviour in the outskirts, resulting in ![]() . The black line guides the eye to zero difference with the fiducial model.
. The black line guides the eye to zero difference with the fiducial model.
Current usage metrics show cumulative count of Article Views (full-text article views including HTML views, PDF and ePub downloads, according to the available data) and Abstracts Views on Vision4Press platform.
Data correspond to usage on the plateform after 2015. The current usage metrics is available 48-96 hours after online publication and is updated daily on week days.
Initial download of the metrics may take a while.