Fig. 8
Download original image
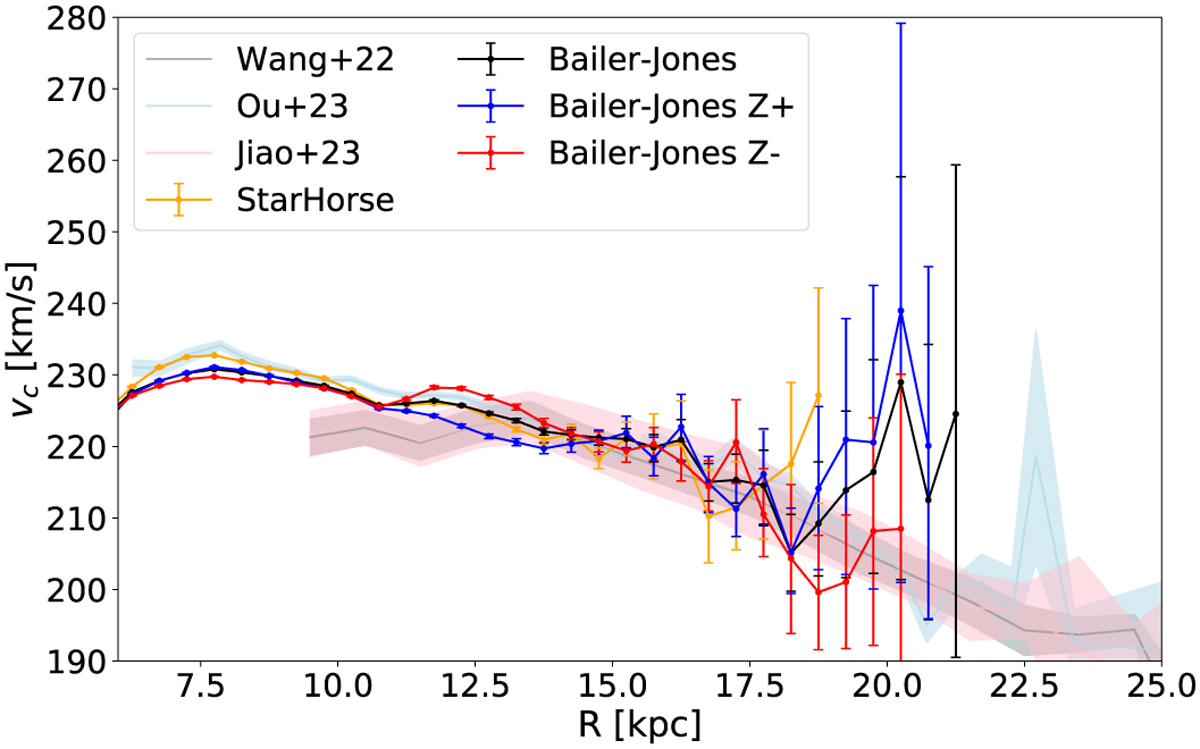
Rotation curves calculated for several samples from Table 1. The black and orange lines show the BJ and SH samples, respectively. The blue and red lines show the BJz+ and BJz− samples, respectively. The grey, light blue, and pink lines and shaded regions show the results from Wang et al. (2023), O23, and Jiao et al. (2023), respectively.
Current usage metrics show cumulative count of Article Views (full-text article views including HTML views, PDF and ePub downloads, according to the available data) and Abstracts Views on Vision4Press platform.
Data correspond to usage on the plateform after 2015. The current usage metrics is available 48-96 hours after online publication and is updated daily on week days.
Initial download of the metrics may take a while.