Open Access
Fig. 7
Download original image
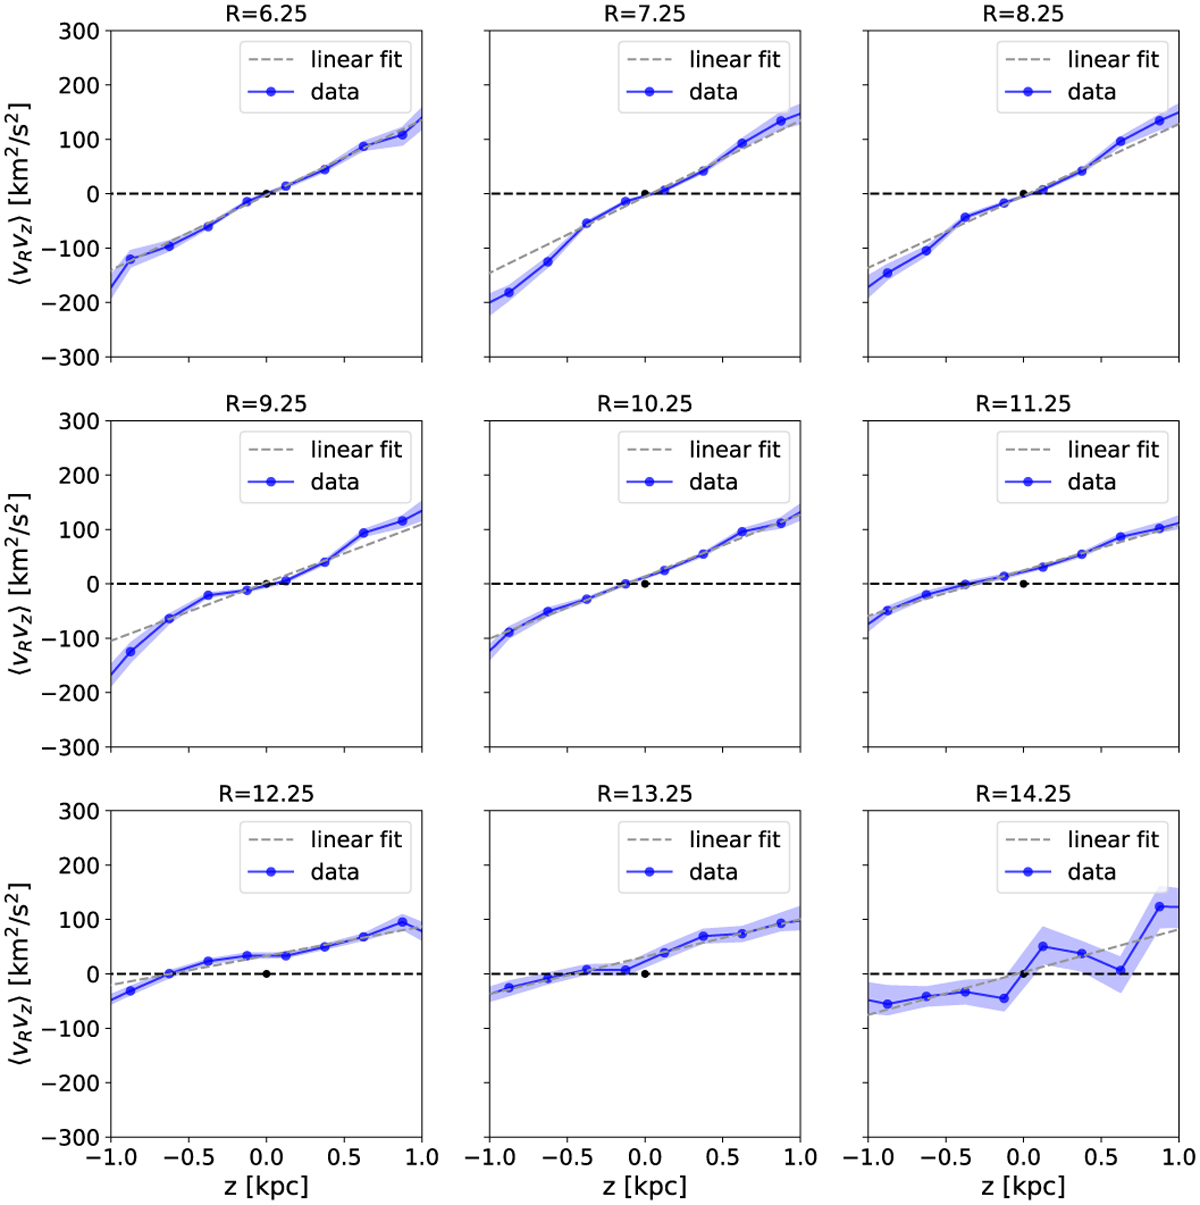
Vertical profile of the correlation 〈υRυɀ〉 for different bins in R. The shaded region shows the bootstrapped error from binning. The dashed grey line is a linear fit to the data between |ɀ| < 1. The dashed black line can guide the eye to where the correlation crosses the origin. The origin is denoted with a black dot.
Current usage metrics show cumulative count of Article Views (full-text article views including HTML views, PDF and ePub downloads, according to the available data) and Abstracts Views on Vision4Press platform.
Data correspond to usage on the plateform after 2015. The current usage metrics is available 48-96 hours after online publication and is updated daily on week days.
Initial download of the metrics may take a while.