Open Access
Fig. 5
Download original image
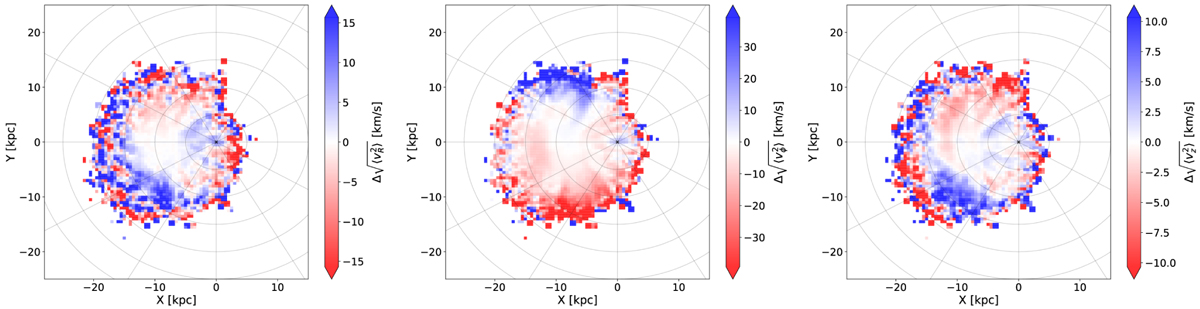
Difference between the distributions of the second moments of υR, υϕ, and υz (from left to right) for the BJz+ and BJz- samples. We use evenly spaced bins in x and y of width 0.5 kpc. The colour bars were limited to within the 1σ value of the distribution of calculated ![]() for the whole sample.
for the whole sample.
Current usage metrics show cumulative count of Article Views (full-text article views including HTML views, PDF and ePub downloads, according to the available data) and Abstracts Views on Vision4Press platform.
Data correspond to usage on the plateform after 2015. The current usage metrics is available 48-96 hours after online publication and is updated daily on week days.
Initial download of the metrics may take a while.