Fig. 3
Download original image
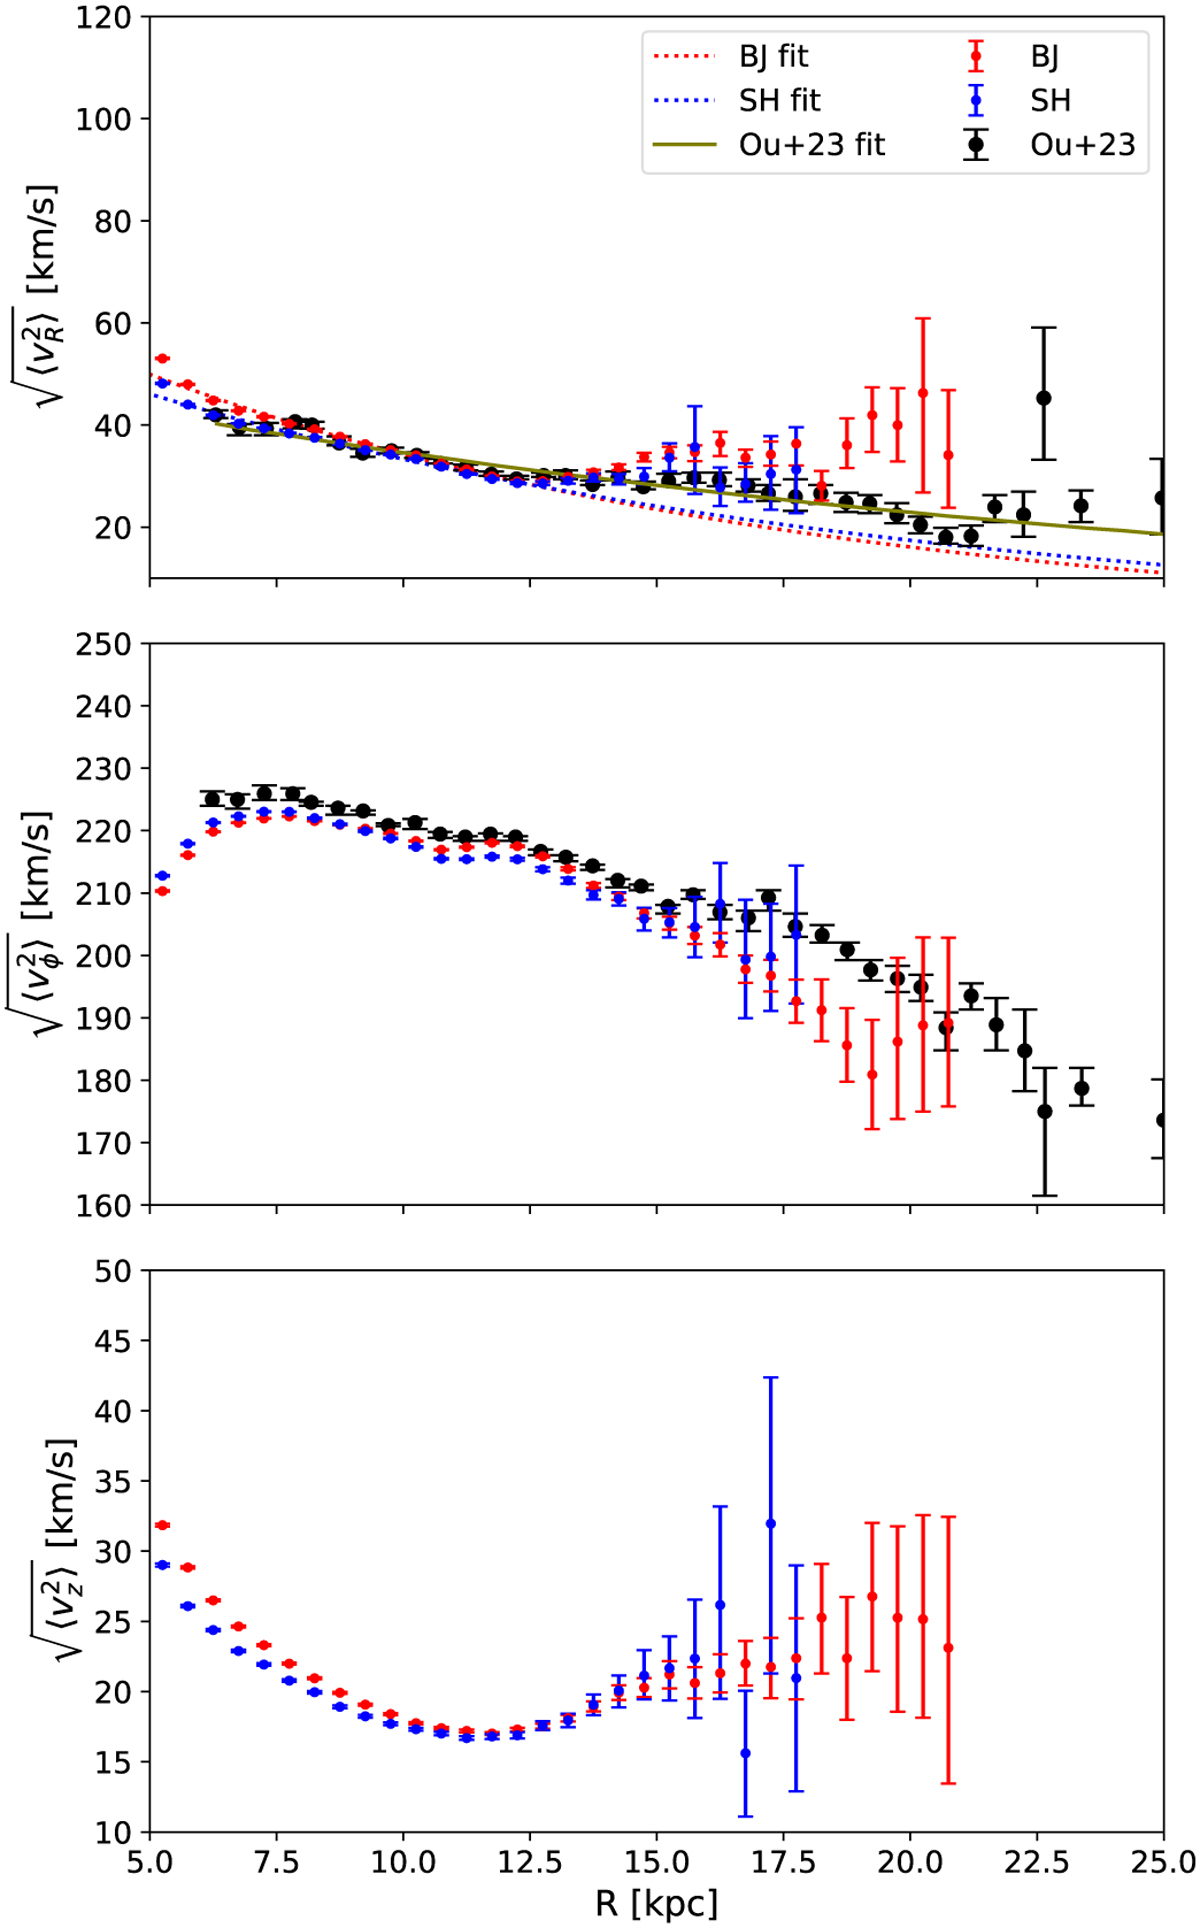
Comparison of the three radial profiles of the second moments in υR, υϕ, and υɀ (from top to bottom) in the MW stellar disc for the BJ (red) and SH (blue) samples. The dotted lines in the top panel are the exponential profile fit from Eq. (4). The error bars show the bootstrapping error from binning. The black dots show the radial profiles from Fig. 3 from O23, and the olive dashed line shows the exponential profile fit to their points. The difference in υϕ between our results and those from O23 is due to a difference in assumed solar velocity parameters and slight differences in the sample.
Current usage metrics show cumulative count of Article Views (full-text article views including HTML views, PDF and ePub downloads, according to the available data) and Abstracts Views on Vision4Press platform.
Data correspond to usage on the plateform after 2015. The current usage metrics is available 48-96 hours after online publication and is updated daily on week days.
Initial download of the metrics may take a while.