Open Access
Fig. C.1
Download original image
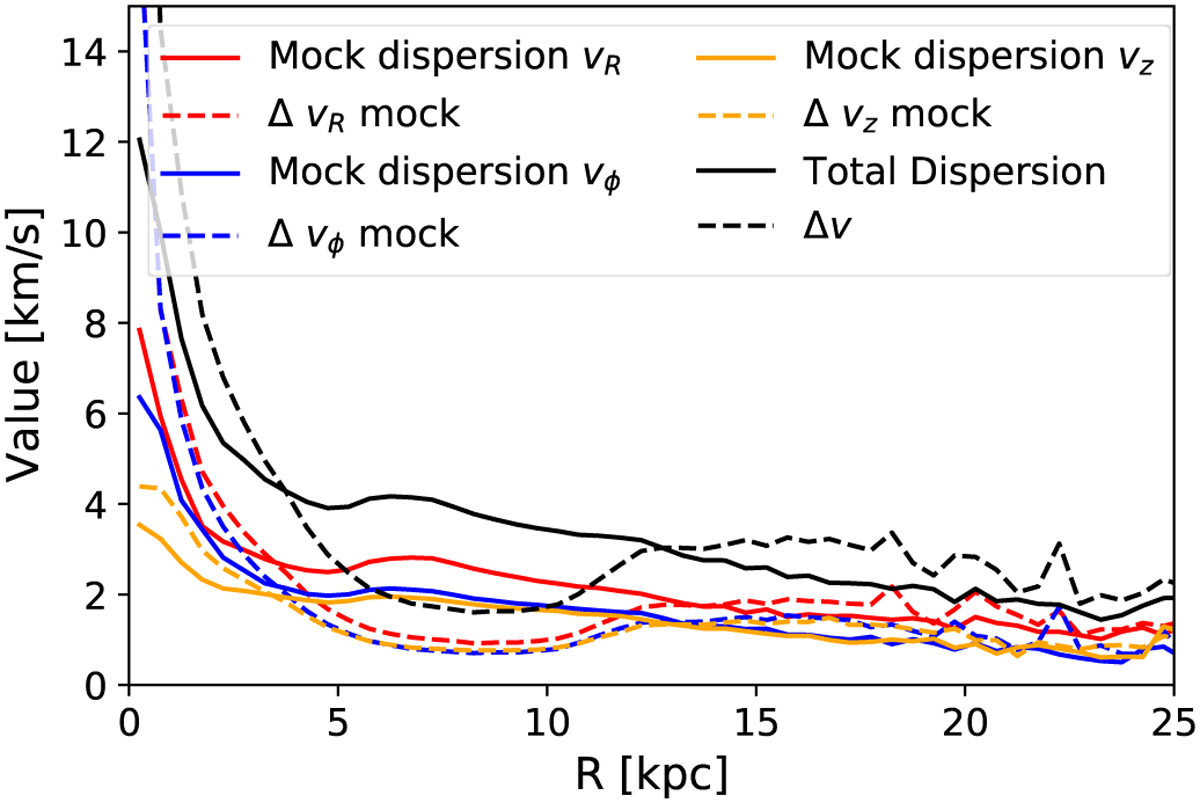
Radial profiles of the average dispersion and displacement of the mock particles with respect to their parent particles. Black lines show the total over all three velocity components. Solid (dashed) lines show the dispersion (displacement). Red, blue and green lines show the values for υR, υϕ and υz respectively.
Current usage metrics show cumulative count of Article Views (full-text article views including HTML views, PDF and ePub downloads, according to the available data) and Abstracts Views on Vision4Press platform.
Data correspond to usage on the plateform after 2015. The current usage metrics is available 48-96 hours after online publication and is updated daily on week days.
Initial download of the metrics may take a while.