Fig. 2
Download original image
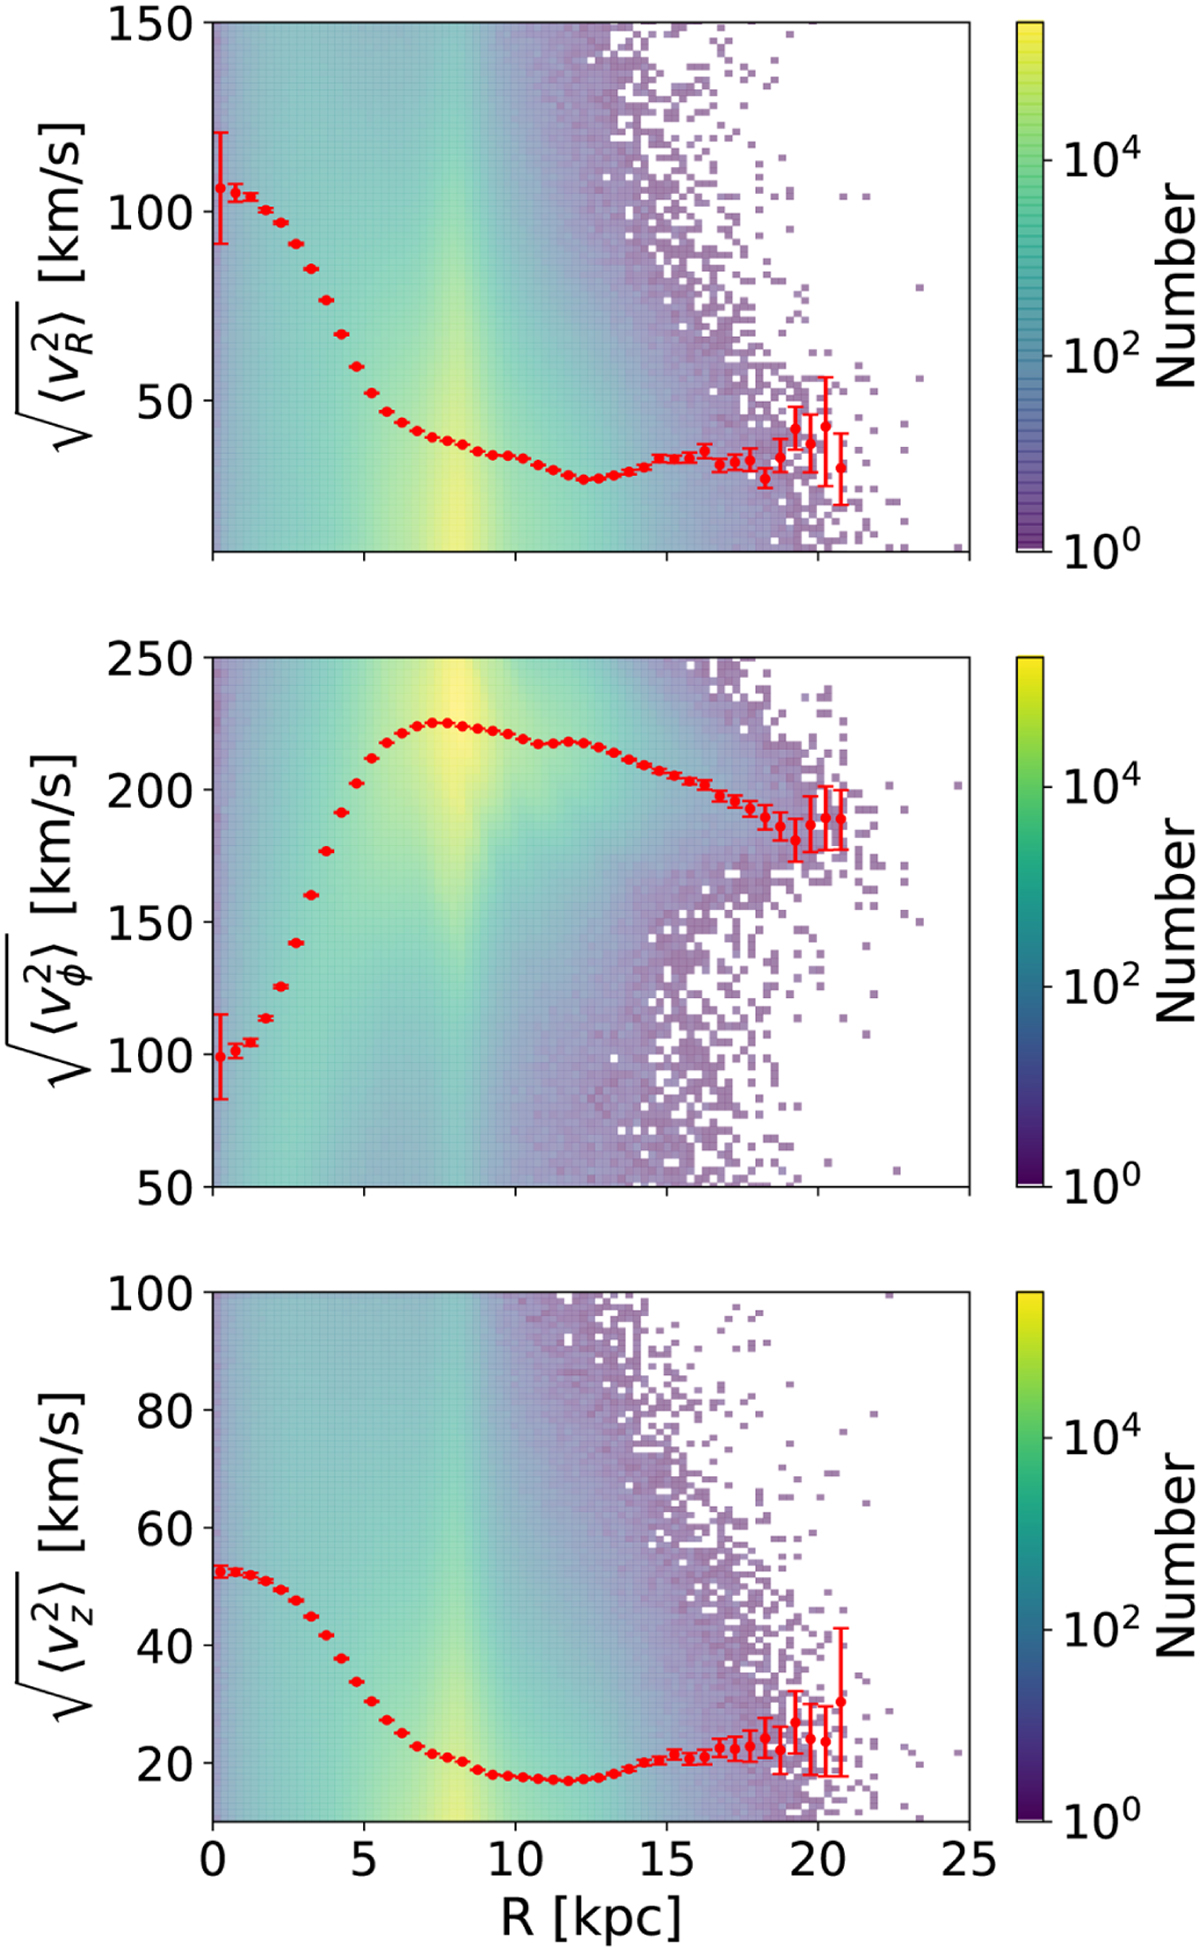
Second moments of the velocity components for the BJ sample. From top to bottom, the panels show ![]() , and
, and ![]() . The background histograms show the distribution of ||(υυT − C)ii|| for our sample: the diagonal elements of the velocity tensor for each star. The red data points show the square root of the second moment of the sample in the radial bins. The error bars show the 1σ errors from bootstrapping. Bins with less than 15 stars are not shown since they typically produce spurious results.
. The background histograms show the distribution of ||(υυT − C)ii|| for our sample: the diagonal elements of the velocity tensor for each star. The red data points show the square root of the second moment of the sample in the radial bins. The error bars show the 1σ errors from bootstrapping. Bins with less than 15 stars are not shown since they typically produce spurious results.
Current usage metrics show cumulative count of Article Views (full-text article views including HTML views, PDF and ePub downloads, according to the available data) and Abstracts Views on Vision4Press platform.
Data correspond to usage on the plateform after 2015. The current usage metrics is available 48-96 hours after online publication and is updated daily on week days.
Initial download of the metrics may take a while.