Fig. 13
Download original image
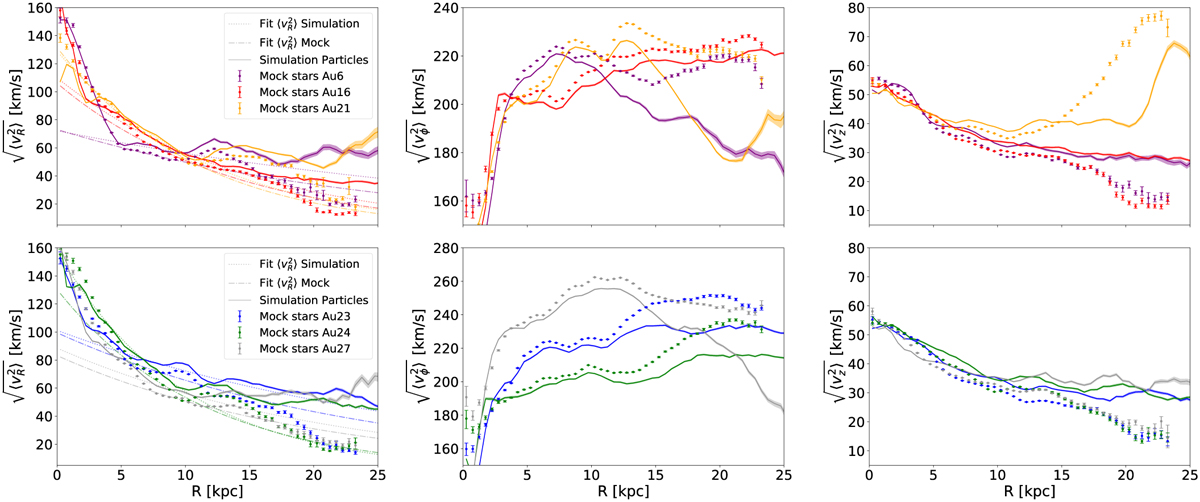
Radial profiles of the second moments of the velocity for the six Aurigaia mocks from Grand et al. (2018). The top row has results for Au6, Au16, and Au21, the bottom row shows Au23, Au24, and Au27. Scattered points with error bars show the results for the mock samples described in Table 3 while solid lines show the result for the stellar particles in the final simulation snapshot of the simulated galaxies. The dashed lines in the left column show the exponential fit to the profile of the mock sample, while the dotted lines show the fit to the profile of the simulation particle sample.
Current usage metrics show cumulative count of Article Views (full-text article views including HTML views, PDF and ePub downloads, according to the available data) and Abstracts Views on Vision4Press platform.
Data correspond to usage on the plateform after 2015. The current usage metrics is available 48-96 hours after online publication and is updated daily on week days.
Initial download of the metrics may take a while.