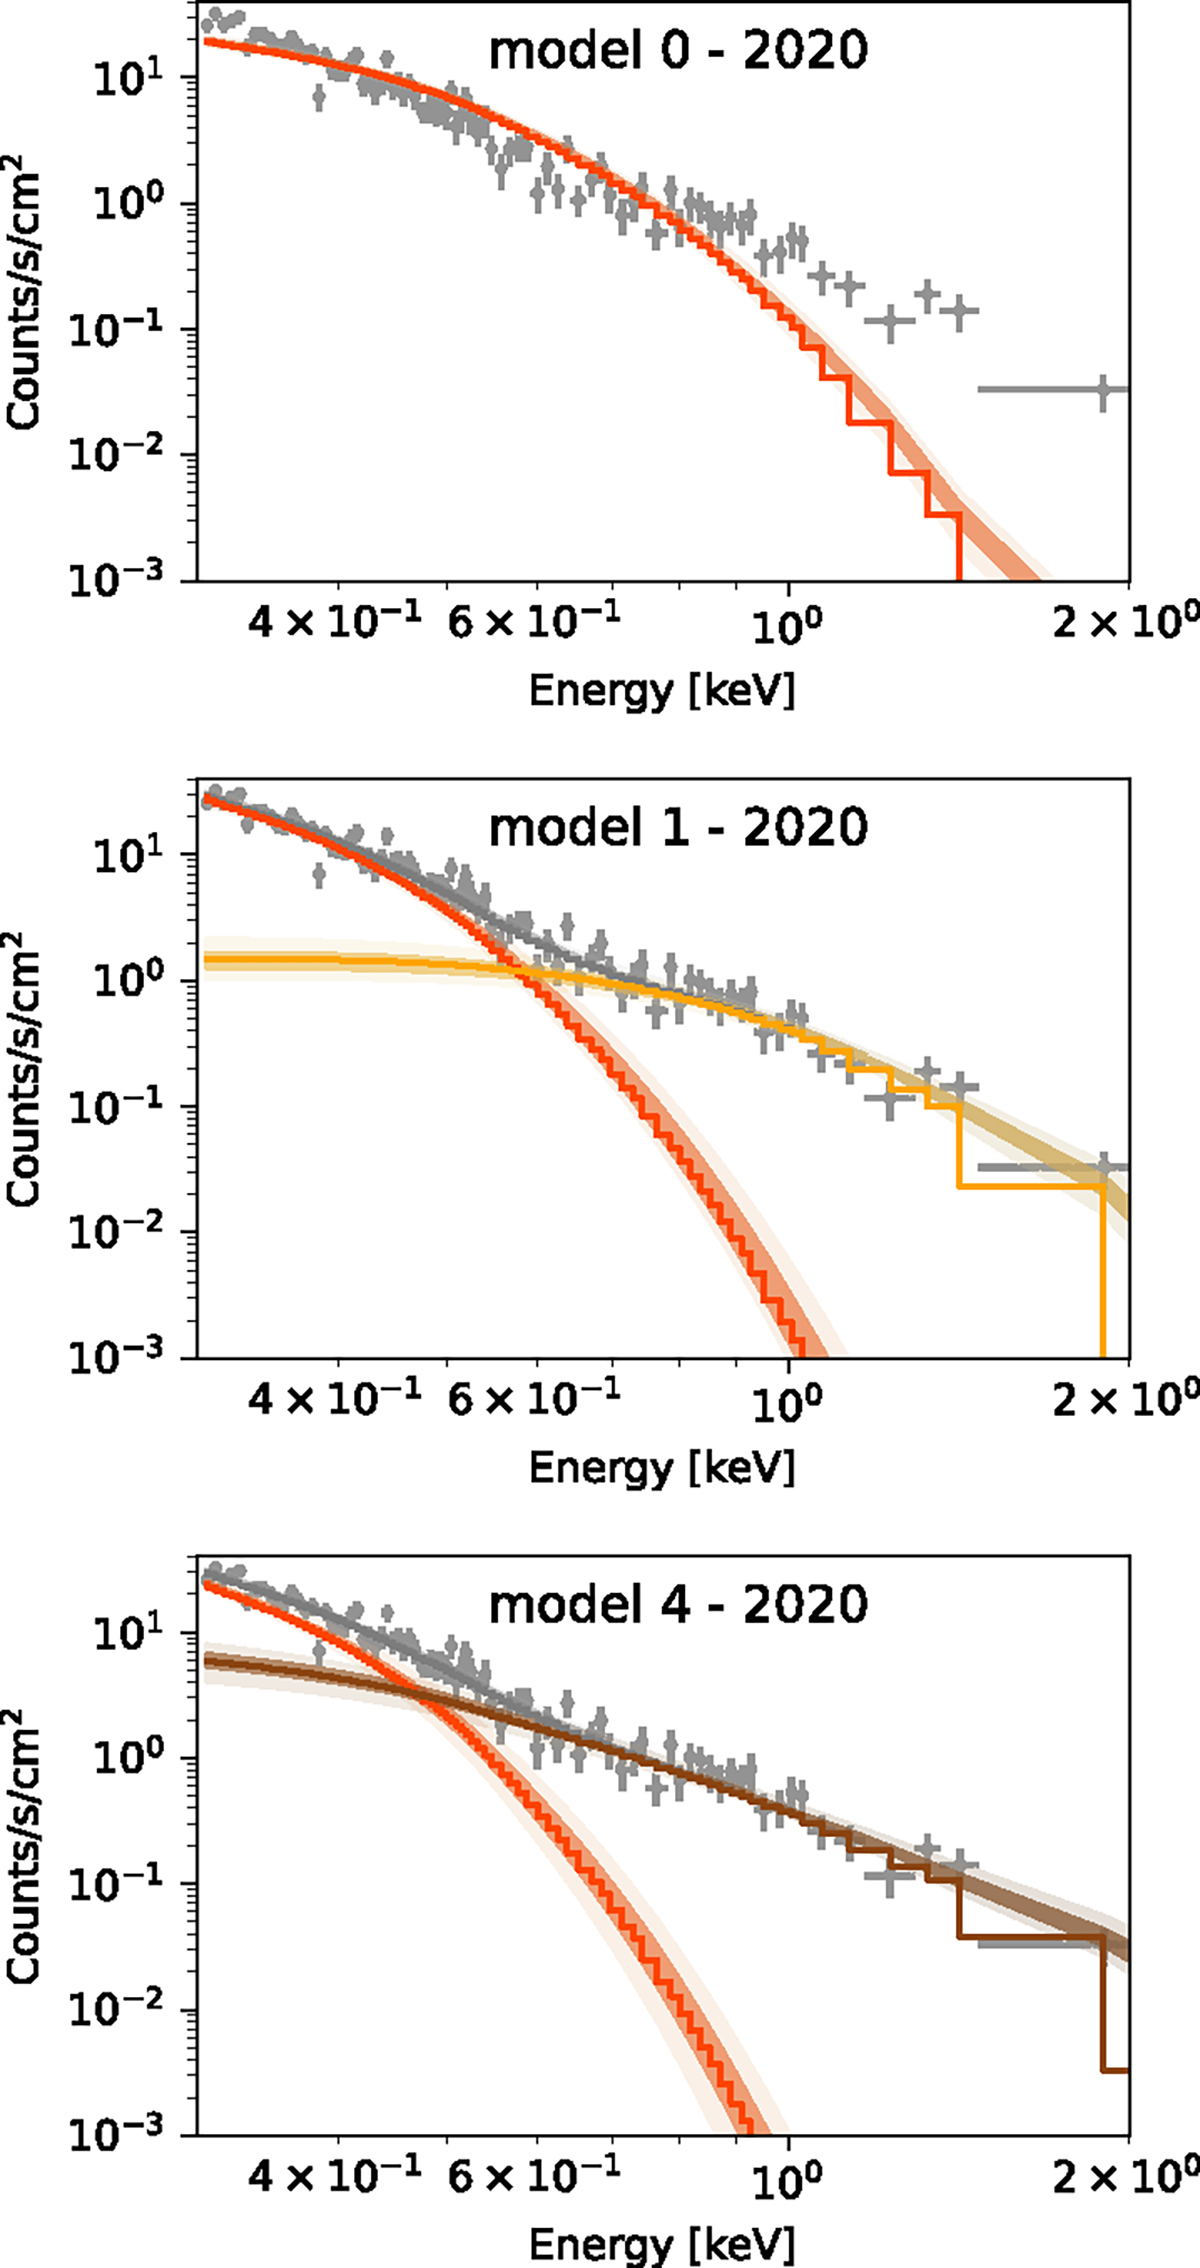
Fig. 6.
Download original image
Quiescent pn spectrum of RX J1301.9+2747 during the 2020 epoch, visually rebinned to 3σ significance and overplotted to the posterior PDF of model 0 ([diskbb], top panel), model 1 ([diskbb + bbody], middle panel), and model 4 ([diskbb + compTT], lower panel). The [diskbb] component is plotted in red, the [bbody] in orange, the [compTT] in brown, and the total model in gray. The complete set of spectra for all epochs compared to models 0 and 1 are shown in Fig. C.2. Spectra are shown up to 2 keV, as at higher energies the signal is dominated by the background, however the data were always fitted up to 10 keV.
Current usage metrics show cumulative count of Article Views (full-text article views including HTML views, PDF and ePub downloads, according to the available data) and Abstracts Views on Vision4Press platform.
Data correspond to usage on the plateform after 2015. The current usage metrics is available 48-96 hours after online publication and is updated daily on week days.
Initial download of the metrics may take a while.