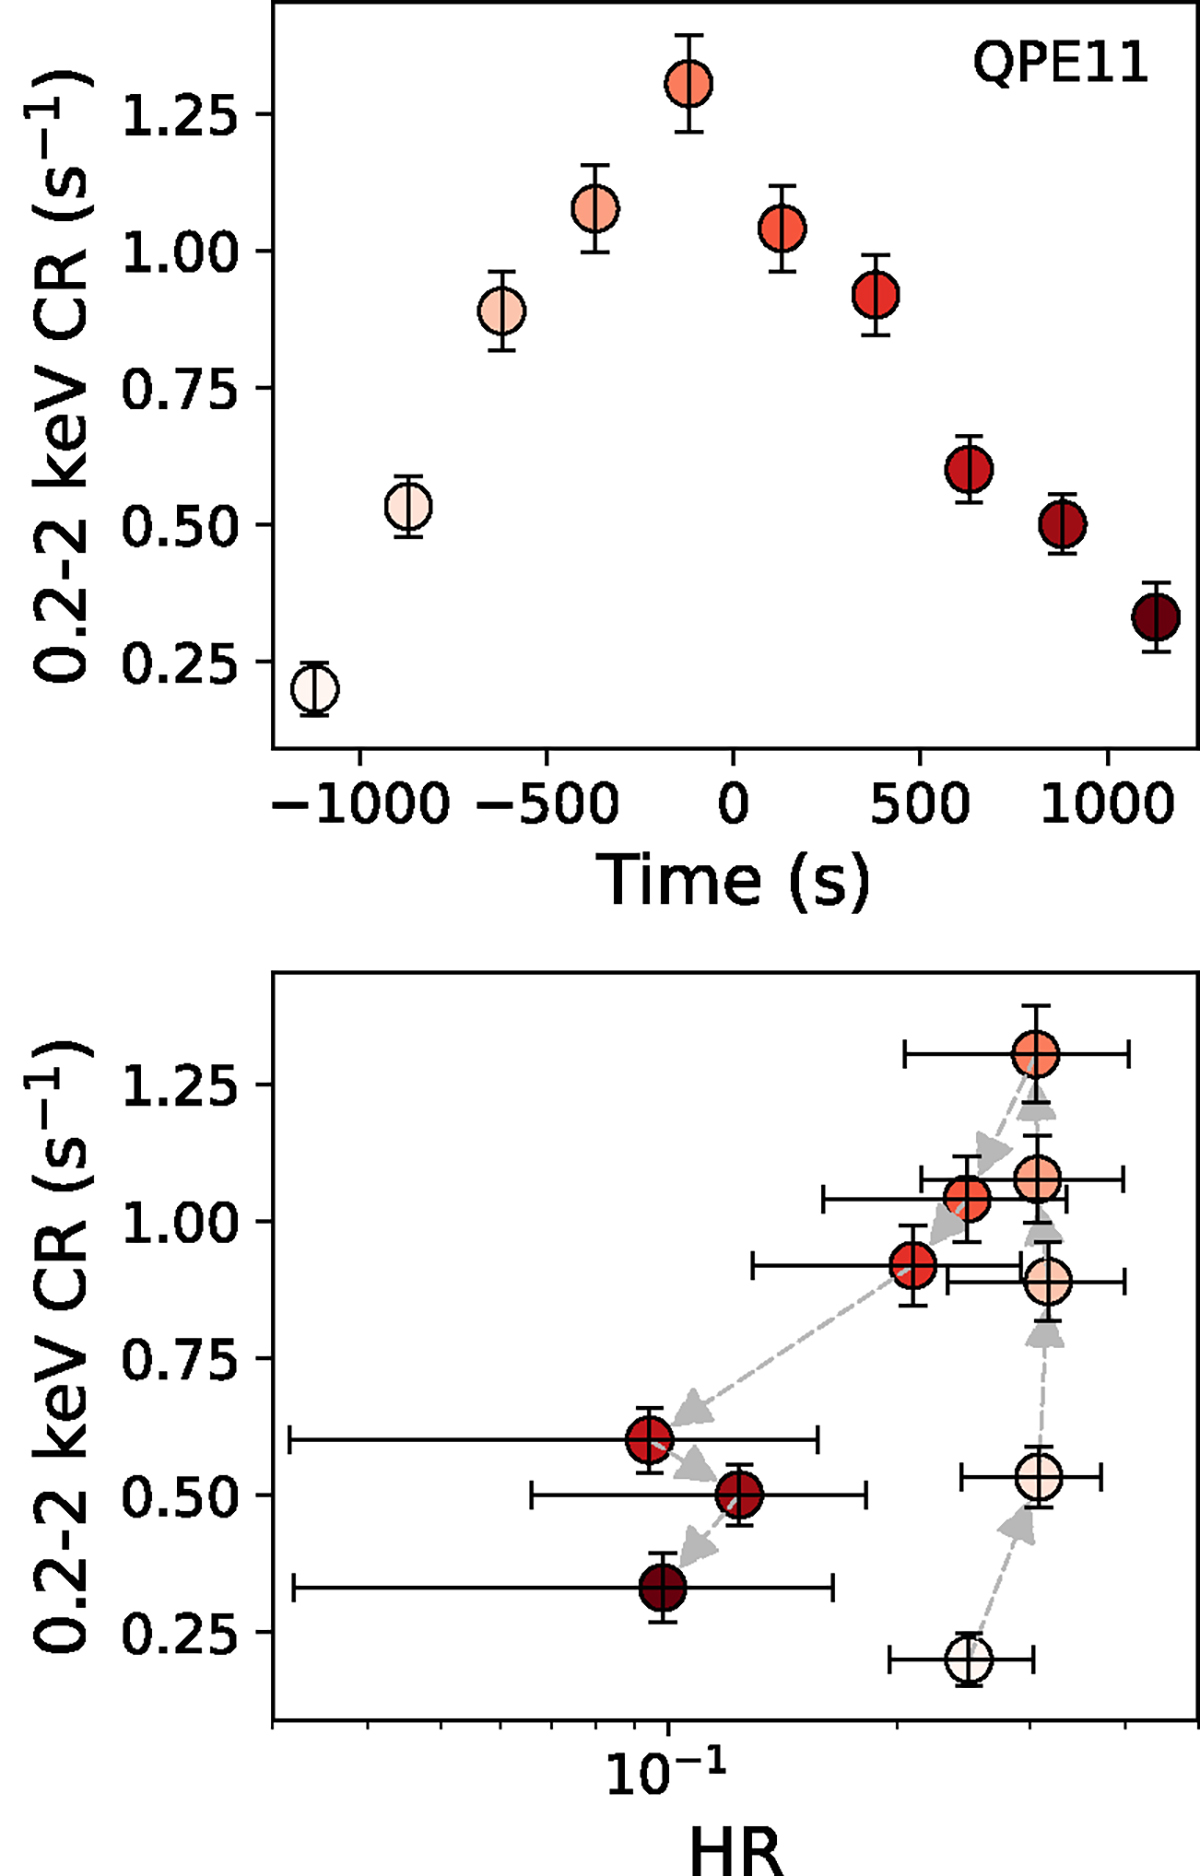
Fig. 5.
Download original image
Top panel: representative 0.2 − 2 keV background-subtracted QPE light curve, centered at the peak and binned to 250 s. Lower panel: hardness ratio (HR) between the 0.6 − 2 keV and the 0.2 − 2 keV count rates as a function of the total count rate, where each point is color-coded following the time evolution of the QPE in the panel above. The HR shows a counter-clockwise evolution, as tracked by the dashed gray arrows. The complete set of HR plots can be found in Fig. B.2.
Current usage metrics show cumulative count of Article Views (full-text article views including HTML views, PDF and ePub downloads, according to the available data) and Abstracts Views on Vision4Press platform.
Data correspond to usage on the plateform after 2015. The current usage metrics is available 48-96 hours after online publication and is updated daily on week days.
Initial download of the metrics may take a while.