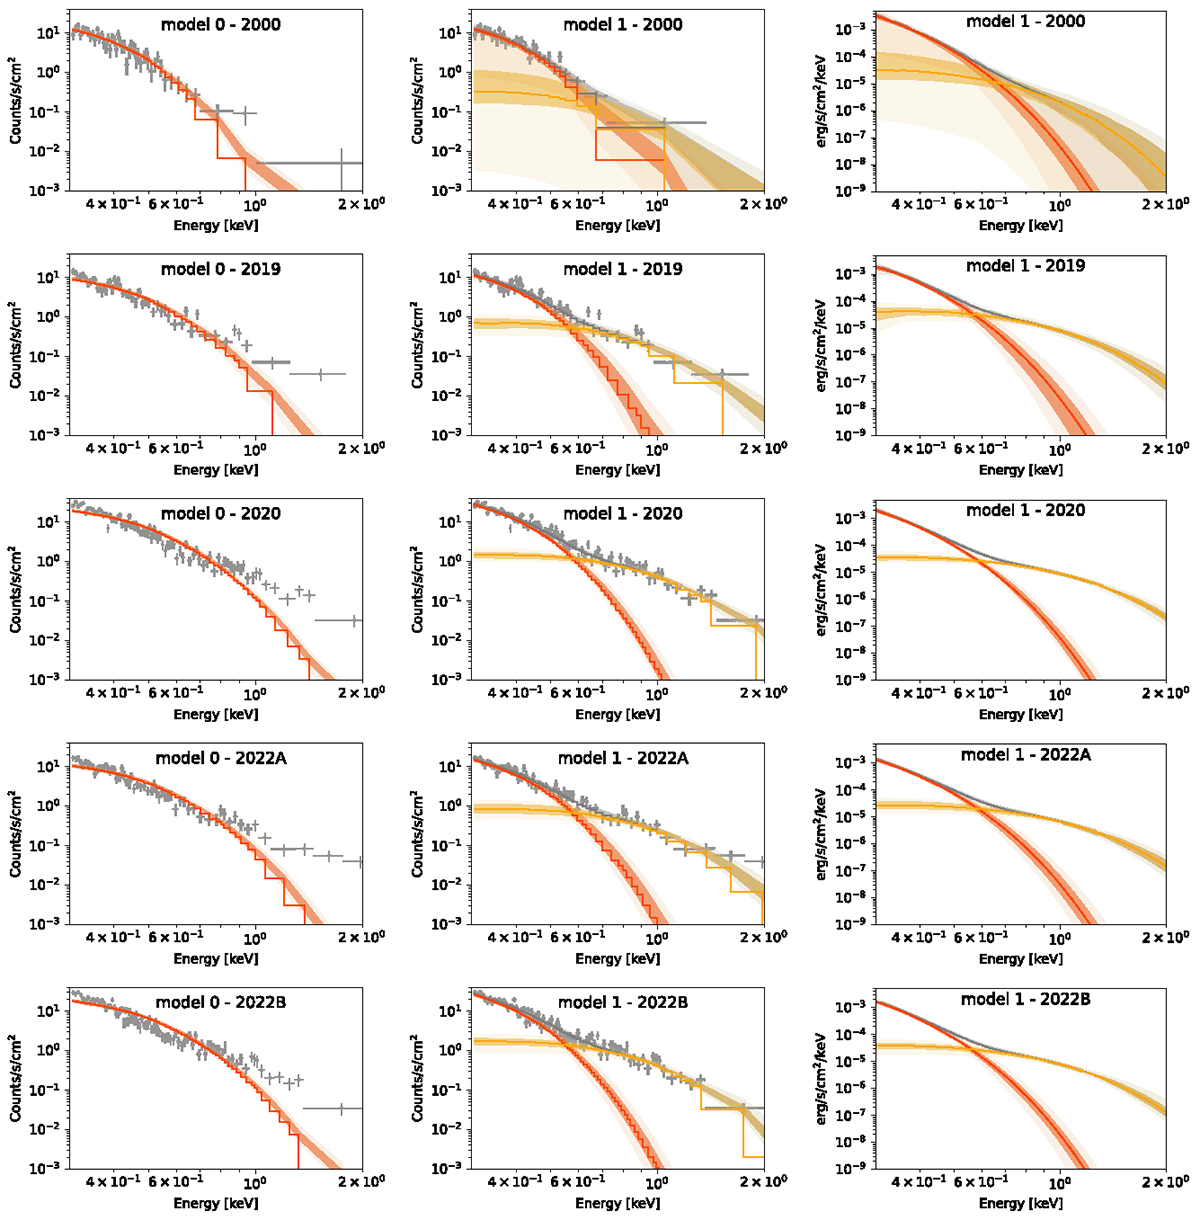
Fig. C.2.
Download original image
The posterior probability distribution of [TBabs*zashift*diskbb] (model 0, left column) and [TBabs*zashift*(diskbb + bbodyrad)] (model 1, central column) applied to the quiescent data for the five epochs of XMM-Newton observation of RX J1301.9+2747. Data are shown for the EPIC-pn camera only and rebinned to 3σ significance. The posterior PDF unconvolved from the instrumental response is plotted for each epoch for the best-fitting model 1 in the right column. The [diskbb] posterior PDF is plotted in dark orange, the [bbodyrad] one in dark yellow, and the total model 1 in gray.
Current usage metrics show cumulative count of Article Views (full-text article views including HTML views, PDF and ePub downloads, according to the available data) and Abstracts Views on Vision4Press platform.
Data correspond to usage on the plateform after 2015. The current usage metrics is available 48-96 hours after online publication and is updated daily on week days.
Initial download of the metrics may take a while.