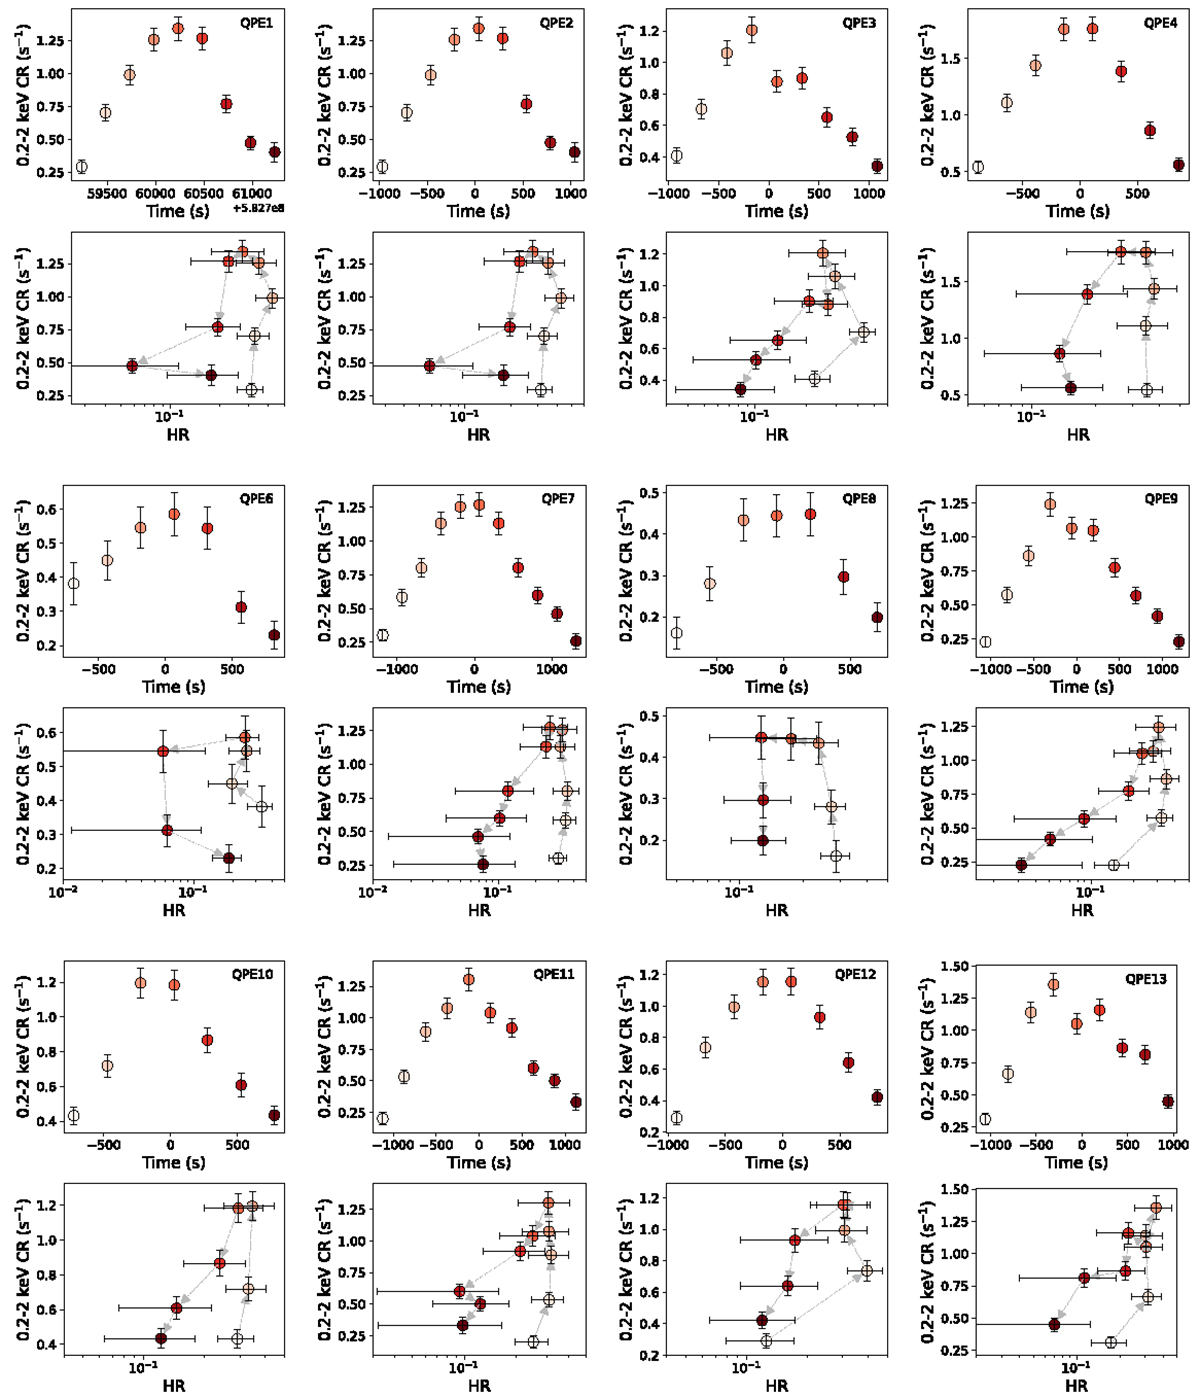
Fig. B.2.
Download original image
For each QPE, we plot in the top panel the 0.2 − 2 keV background-subtracted QPE light curve, centered around the QPE peak and binned to 250 s, and in the lower panel the hardness ratio HR = CR(0.6 − 2)/CR(0.2 − 2), where CR(0.6 − 2) is the count rate in the 0.6 − 2 keV band and CR(0.2 − 2) is the total count rate in the 0.2 − 2 keV band. Each point is color-coded following the time evolution of the QPE in the panel above. The HR shows a counterclockwise evolution, as highlighted by the dashed arrow. All these quantities have been computed using the pn data only.
Current usage metrics show cumulative count of Article Views (full-text article views including HTML views, PDF and ePub downloads, according to the available data) and Abstracts Views on Vision4Press platform.
Data correspond to usage on the plateform after 2015. The current usage metrics is available 48-96 hours after online publication and is updated daily on week days.
Initial download of the metrics may take a while.