Fig. 2.
Download original image
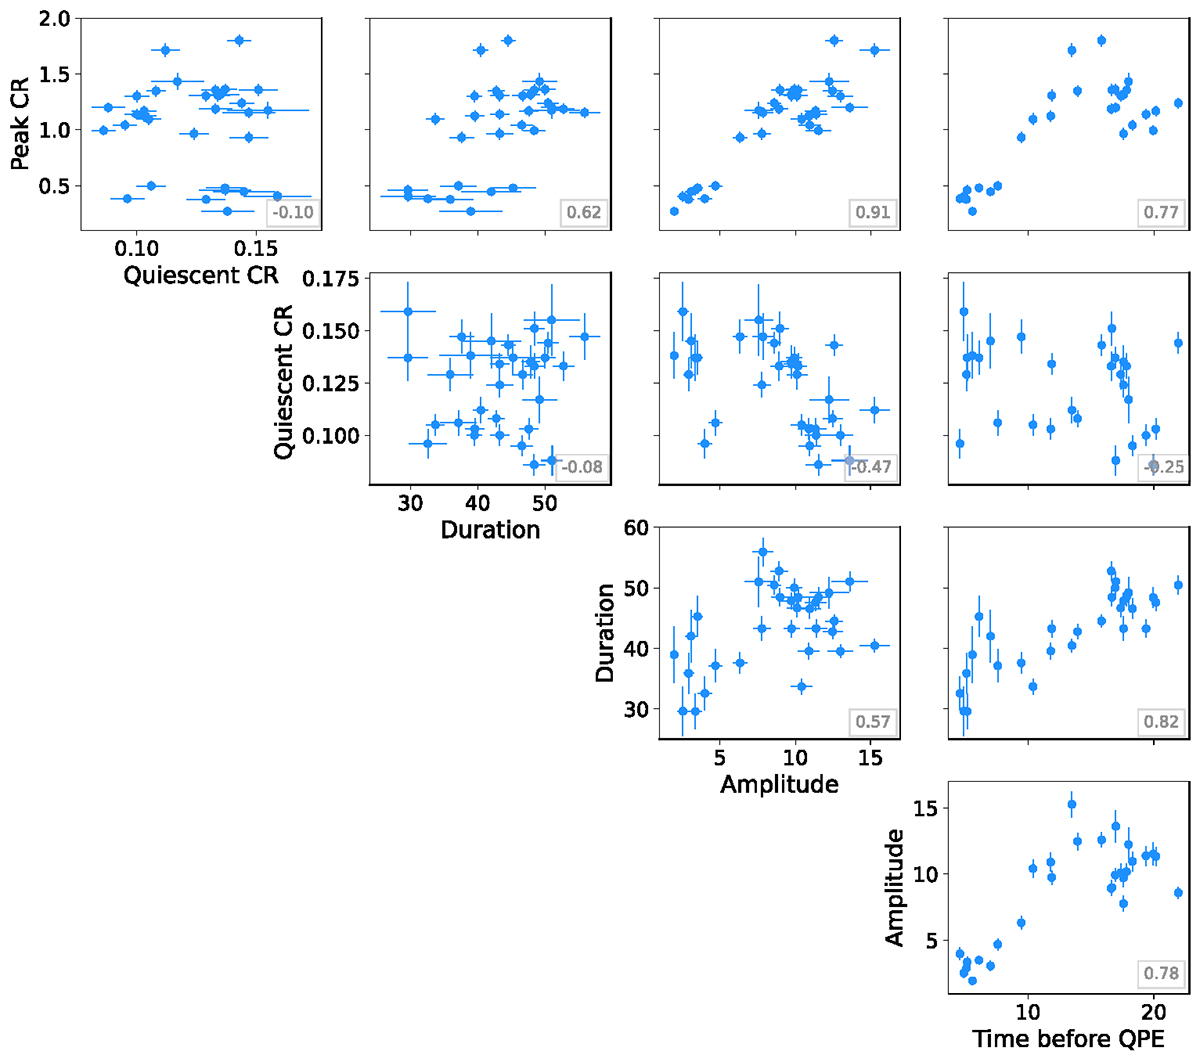
Properties of the QPEs of RX J1301.9+2747, derived from the XMM-Newton EPIC light curves: QPE peak count rate (CR), in s−1; local quiescence count rate (CR), in s−1; QPE duration, in minutes; QPE amplitude; time between QPE number n and QPE number n − 1, in kiloseconds (ks). For each quantity, we plot the median of the posterior PDF along with its 1 standard deviation error bar. The gray boxes in the lower right corner of each subplot report the correlation coefficients between the parameters.
Current usage metrics show cumulative count of Article Views (full-text article views including HTML views, PDF and ePub downloads, according to the available data) and Abstracts Views on Vision4Press platform.
Data correspond to usage on the plateform after 2015. The current usage metrics is available 48-96 hours after online publication and is updated daily on week days.
Initial download of the metrics may take a while.