Fig. B.1.
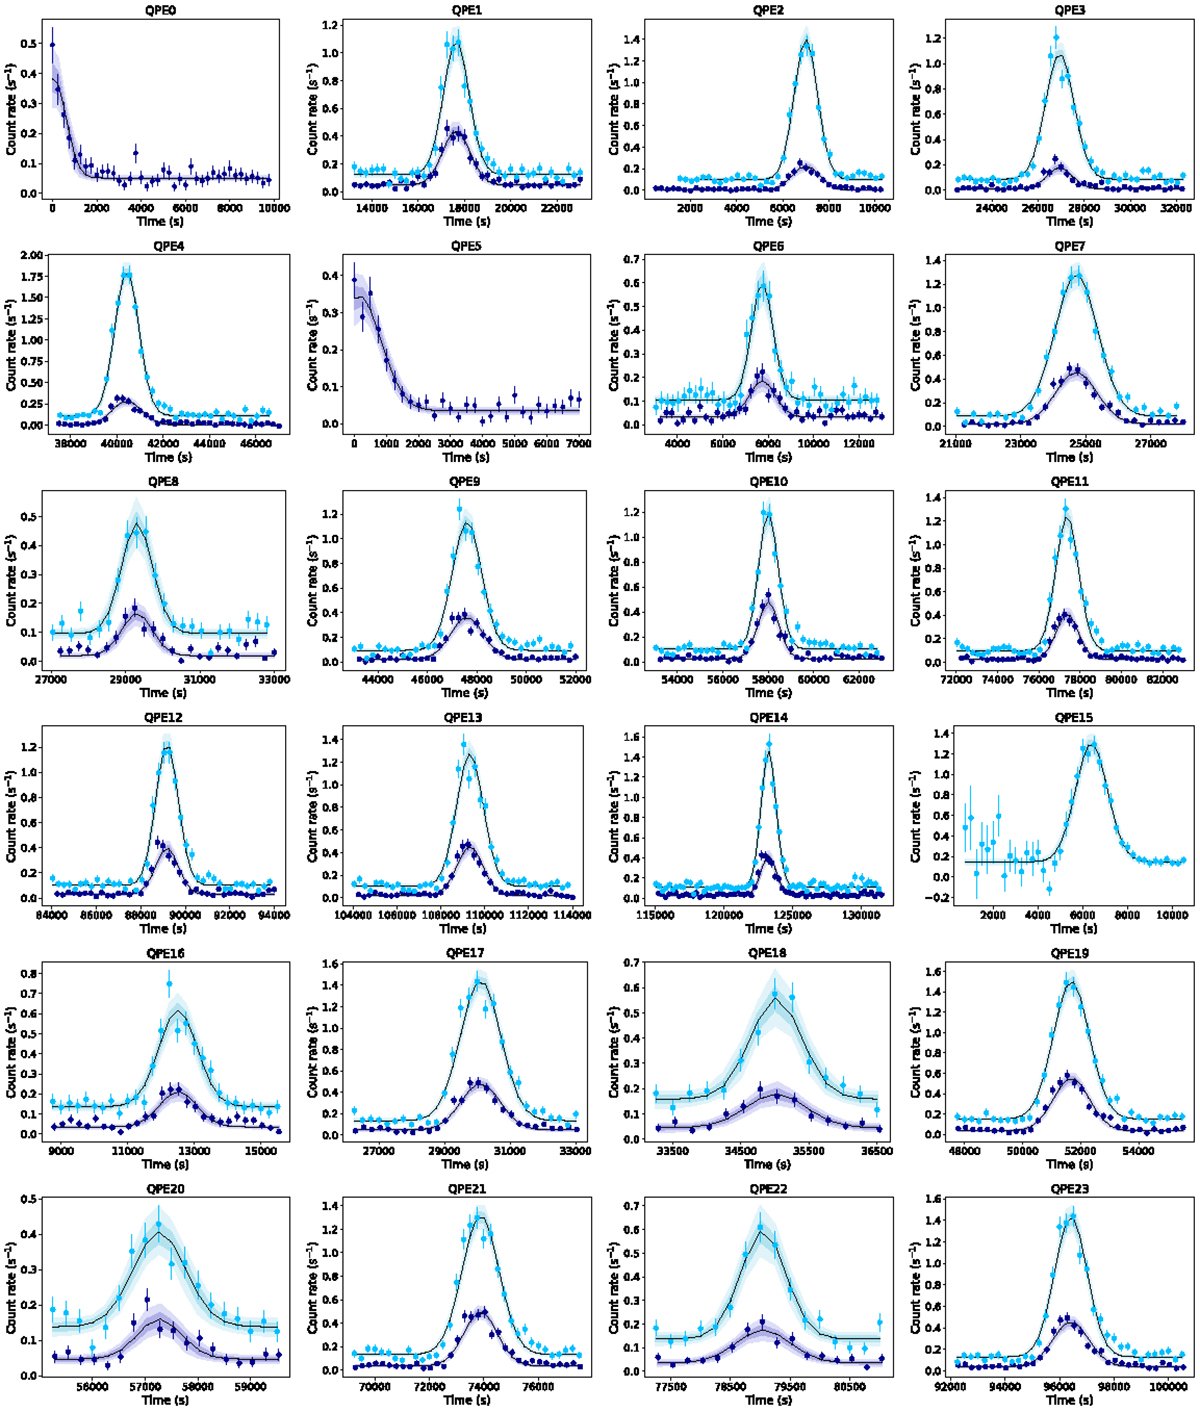
Download original image
Zoom on the light curves of RX J1301.9+2747 centered on the QPEs detected by the EPIC cameras (pn in light blue, MOS in dark blue) between 2000 and 2022. The black line represents the median of the posterior PDF of the model [constant + Gaussian] used to fit the light curves, while the shaded areas represent the 1σ and 2σ equivalent percentiles. Time on the x-axis is computed from the beginning of each observation in Mission Reference Time: 92866770 s for QPE0−QPE1; 675637593 s for QPE2−QPE4; 710876963 s for QPE5−QPE14; 771890338 s for QPE15−QPE24; and 772064151 s for QPE25−QPE33.
Current usage metrics show cumulative count of Article Views (full-text article views including HTML views, PDF and ePub downloads, according to the available data) and Abstracts Views on Vision4Press platform.
Data correspond to usage on the plateform after 2015. The current usage metrics is available 48-96 hours after online publication and is updated daily on week days.
Initial download of the metrics may take a while.