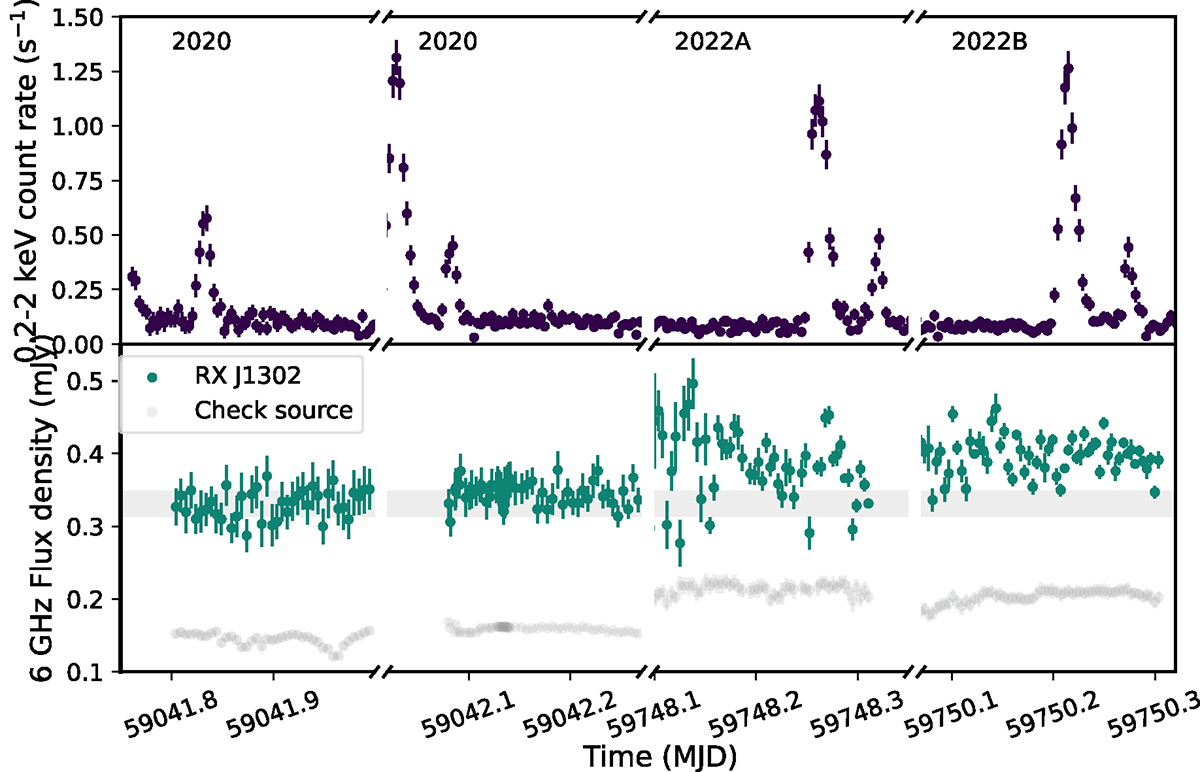
Fig. 17.
Download original image
Simultaneous X-ray and radio light curves for the 2020, 2022A, and 2022B epochs: the top panel reports the 0.2 − 2 keV light curve, and the lower panel the radio light curve at 6 GHz as measured by the VLA. In the lower panel, RX J1301.9+2747 is shown in green, and a different radio source in the field is shown in gray to serve as a check source. Each portion of the broken axes represents 0.25 d. Note that the flux density of the check source has been scaled down by a factor of 15. The gray shaded region shows the mean value for the 2020 observation plus or minus 5%, the absolute accuracy of the VLA flux density calibration.
Current usage metrics show cumulative count of Article Views (full-text article views including HTML views, PDF and ePub downloads, according to the available data) and Abstracts Views on Vision4Press platform.
Data correspond to usage on the plateform after 2015. The current usage metrics is available 48-96 hours after online publication and is updated daily on week days.
Initial download of the metrics may take a while.