Open Access
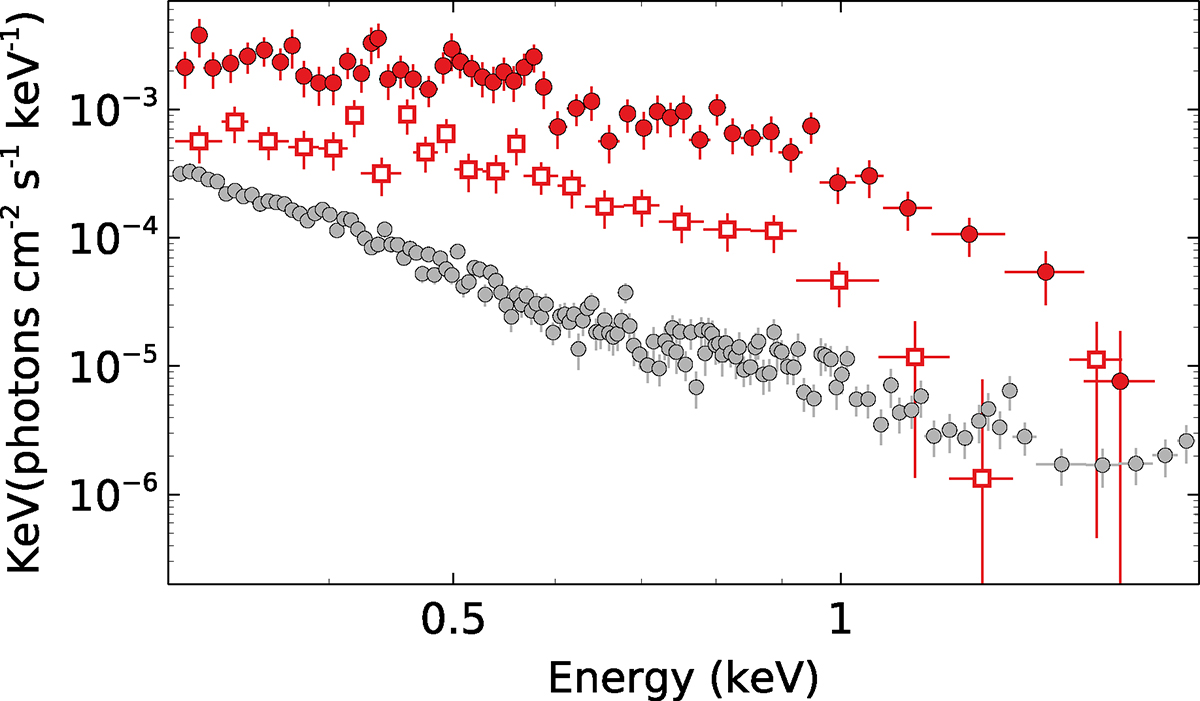
Fig. 16.
Download original image
Average 0.3 − 2 keV EF(E) quiescent spectrum of RX J1301.9+2747 (gray) plotted together with the average weak QPE (empty squares) and strong QPE (filled circles) spectra extracted during the peak. The QPE spectra are background-subtracted with the average quiescent spectrum used as background.
Current usage metrics show cumulative count of Article Views (full-text article views including HTML views, PDF and ePub downloads, according to the available data) and Abstracts Views on Vision4Press platform.
Data correspond to usage on the plateform after 2015. The current usage metrics is available 48-96 hours after online publication and is updated daily on week days.
Initial download of the metrics may take a while.