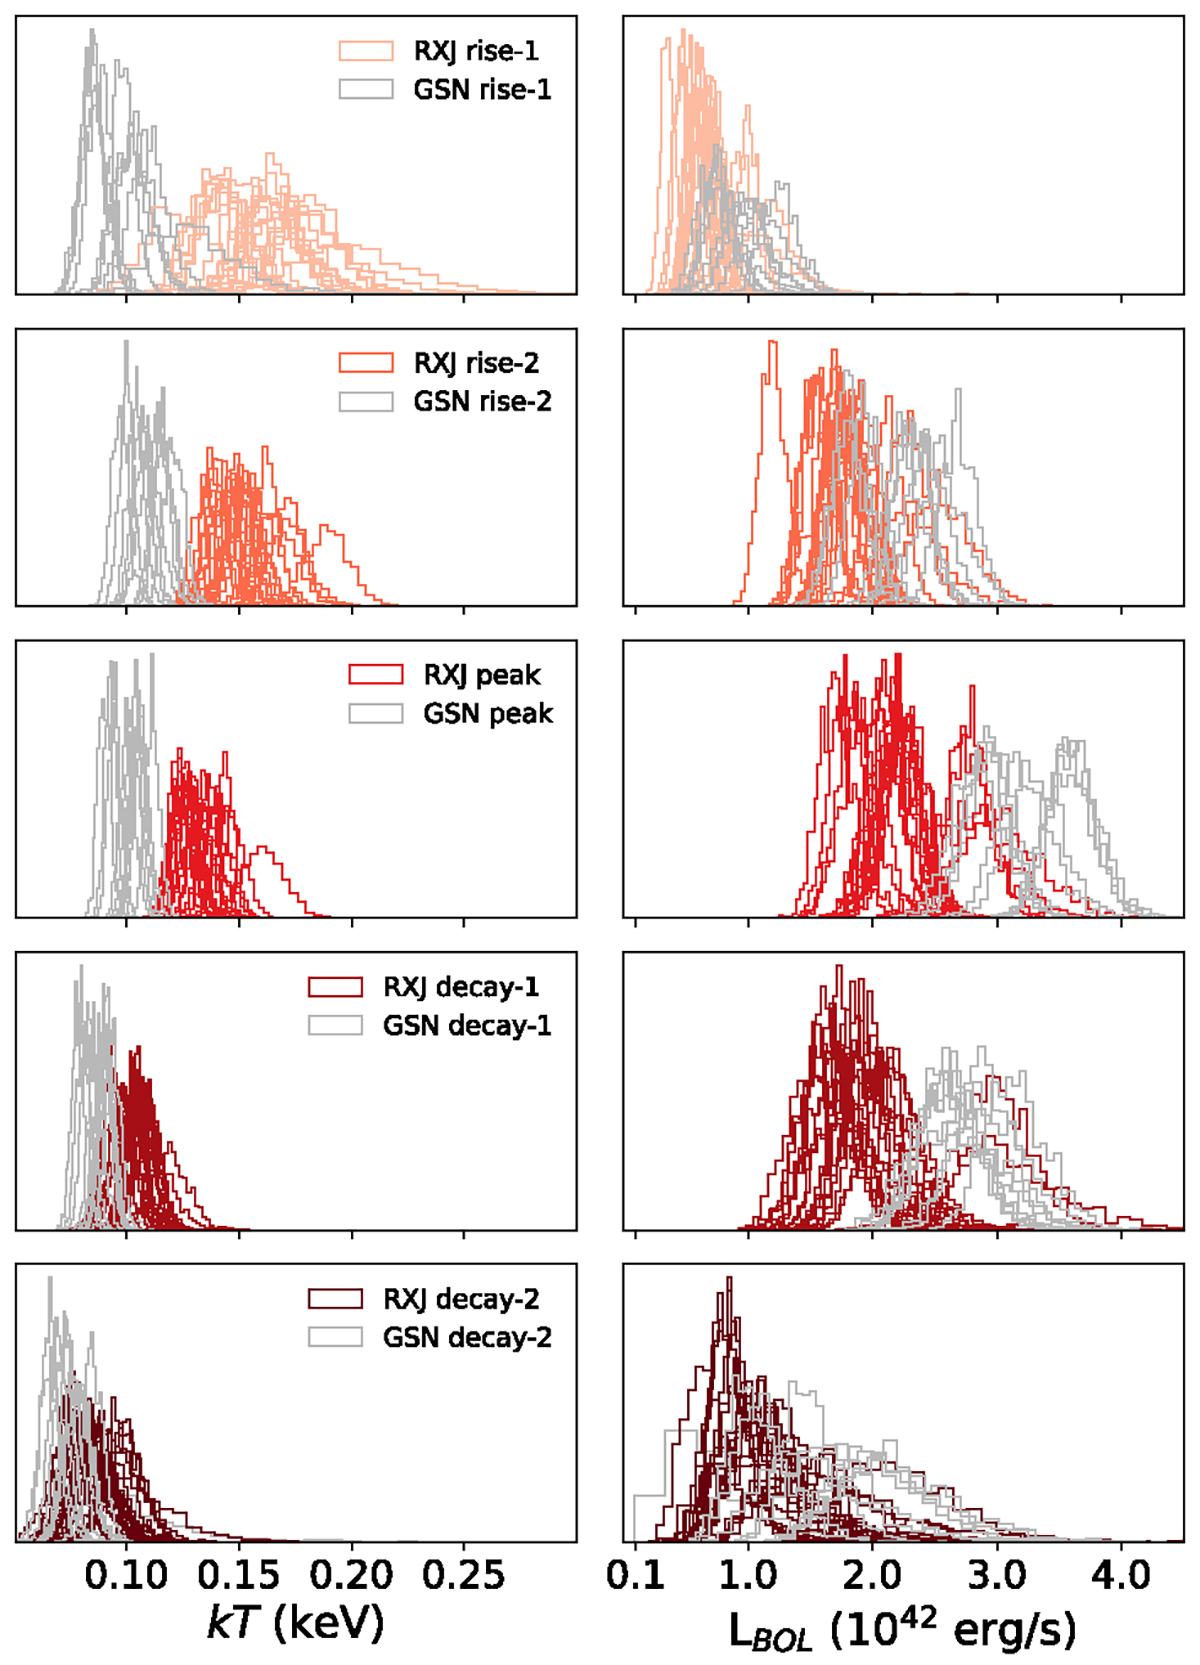
Fig. 15.
Download original image
Histograms of the posterior PDFs of the temperature (left column) and of the bolometric luminosity (right column) of a blackbody model compared to each strong QPE spectral slice. From upper to lower panels: rise-1 in pink, rise-2 in orange, peak in red, decay-1 in dark red, and decay-2 in brown. The gray histograms report the GSN 069 strong QPEs data.
Current usage metrics show cumulative count of Article Views (full-text article views including HTML views, PDF and ePub downloads, according to the available data) and Abstracts Views on Vision4Press platform.
Data correspond to usage on the plateform after 2015. The current usage metrics is available 48-96 hours after online publication and is updated daily on week days.
Initial download of the metrics may take a while.