Open Access
Fig. 13.
Download original image
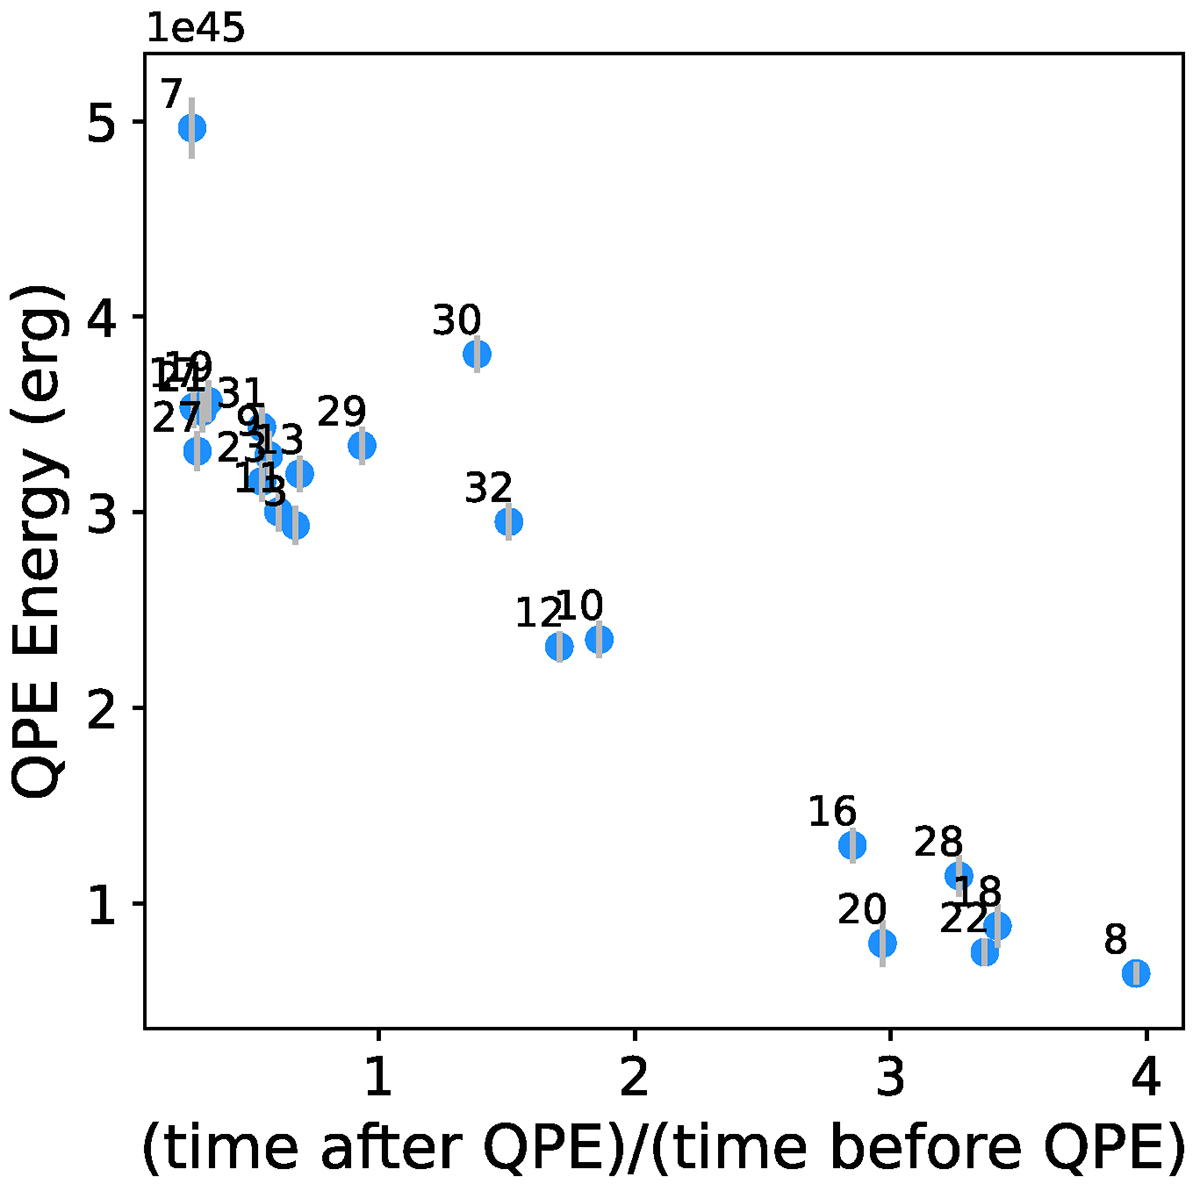
For each QPE number n of RX J1301.9+2747 with pn spectral analysis available, the total emitted energy is plotted against the ratio between the time interval between the peaks of QPE number n and QPE number n − 1 and the time interval between the peaks of QPE number n + 1 and QPE number n.
Current usage metrics show cumulative count of Article Views (full-text article views including HTML views, PDF and ePub downloads, according to the available data) and Abstracts Views on Vision4Press platform.
Data correspond to usage on the plateform after 2015. The current usage metrics is available 48-96 hours after online publication and is updated daily on week days.
Initial download of the metrics may take a while.