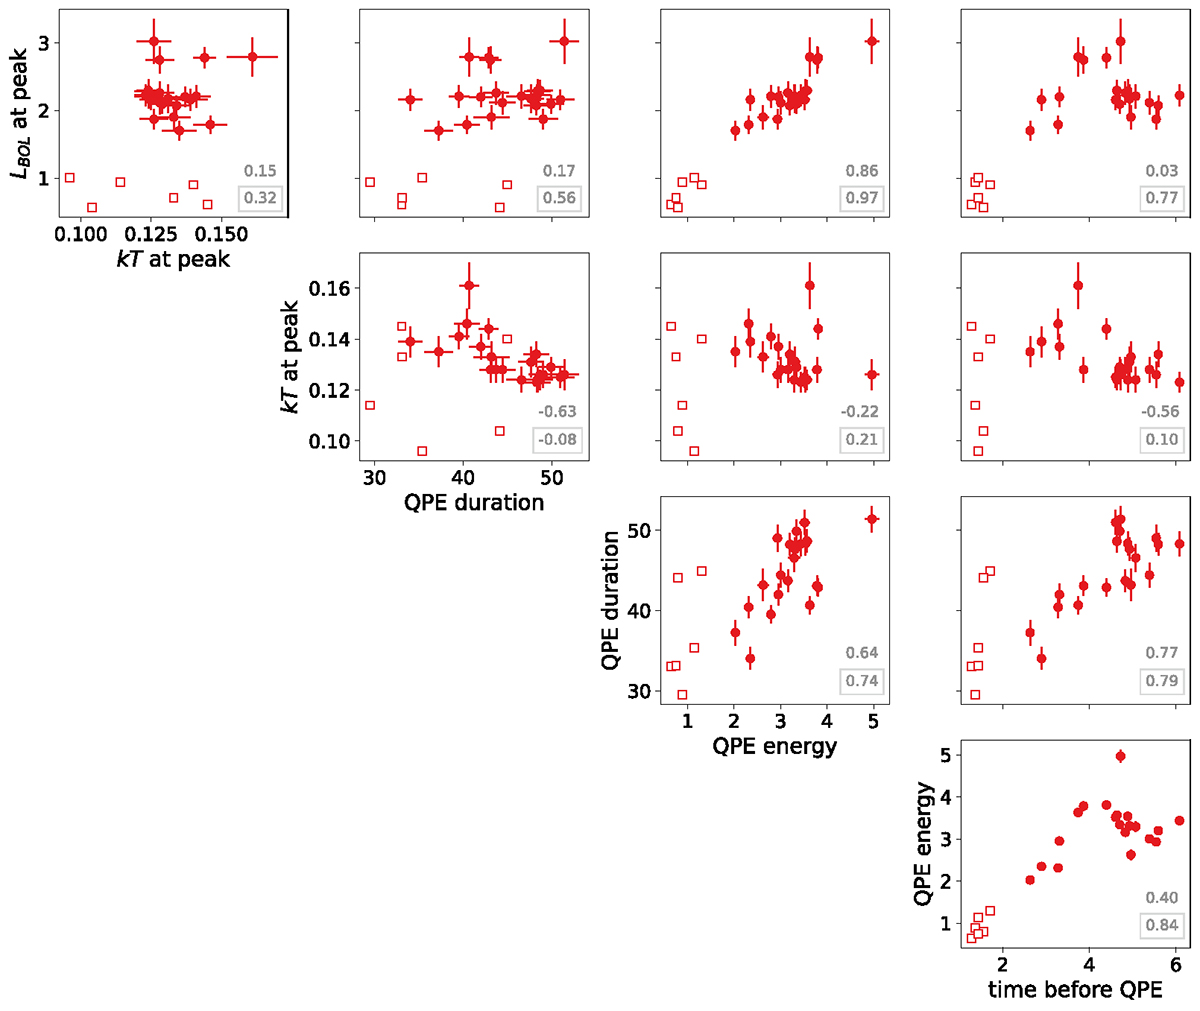
Fig. 12.
Download original image
Corner plot for the medians of the posterior PDFs of various QPE parameters of RX J1301.9+2747. The quantities plotted for each QPE are: the bolometric luminosity at the QPE peak (1042 erg s−1); the temperature at the QPE peak (keV); the QPE duration (m); the QPE total emitted energy (1045 erg); and the time preceding each QPE (h). Strong QPEs are plotted with filled circles, weak QPEs with open squares. Error bars for weak QPEs have been omitted for clarity. A couple of correlation coefficients between the parameters is reported in the lower right corner of each plot: strong QPEs only on top, and both strong and weak QPEs in the gray boxes below.
Current usage metrics show cumulative count of Article Views (full-text article views including HTML views, PDF and ePub downloads, according to the available data) and Abstracts Views on Vision4Press platform.
Data correspond to usage on the plateform after 2015. The current usage metrics is available 48-96 hours after online publication and is updated daily on week days.
Initial download of the metrics may take a while.