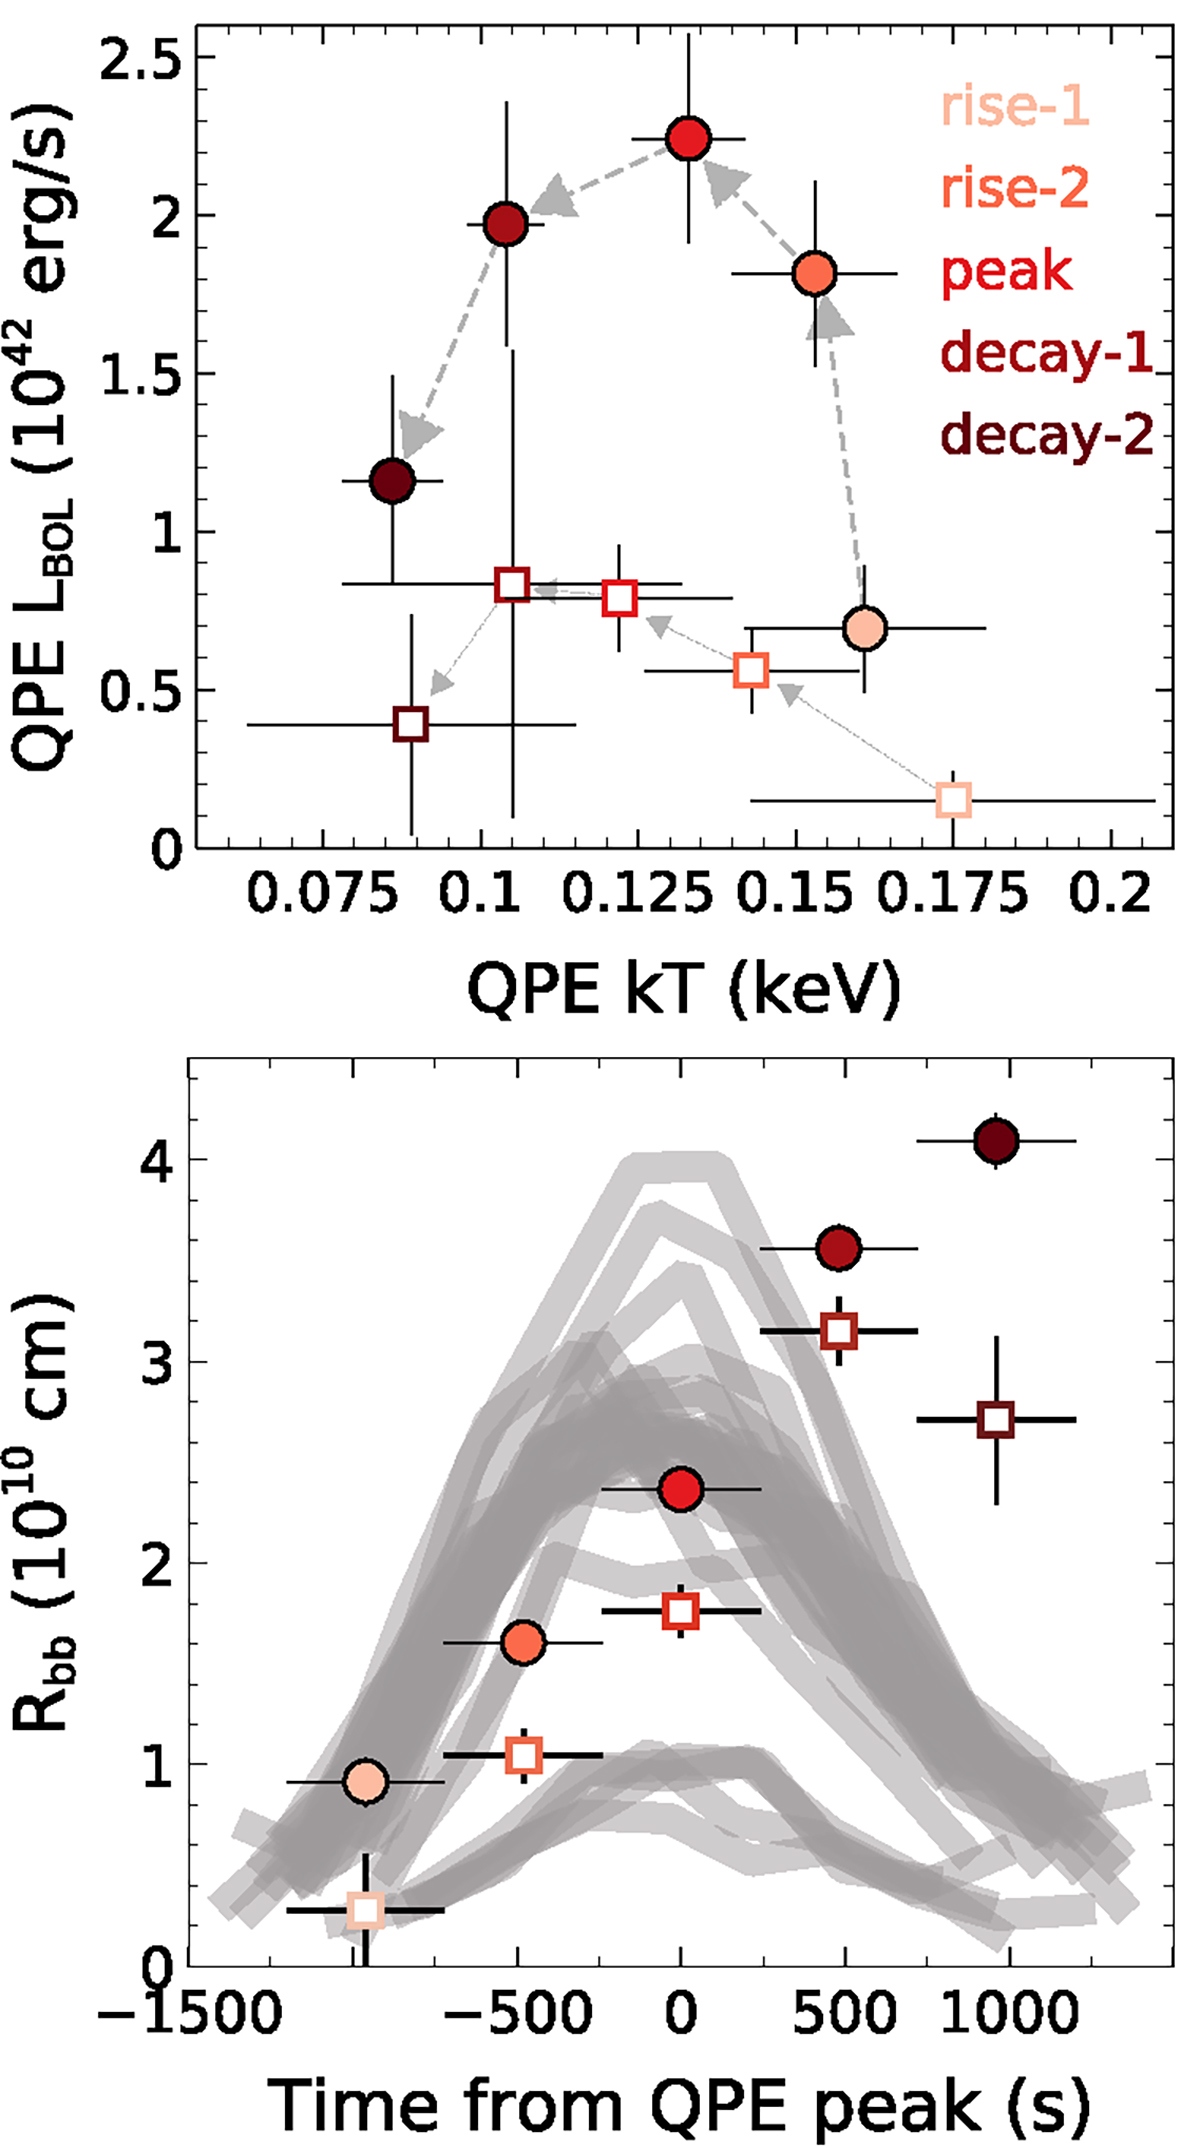
Fig. 11.
Download original image
Top panel: average of the posterior PDFs of the temperature kT and bolometric luminosity LBOL of a redshifted blackbody model ([zashift*bbodyrad] in Xspec) compared to the five spectral slices of each QPE of RX J1301.9+2747. Weak QPEs are plotted with open squares, and strong QPEs with filled circles. The color code during the QPE evolution is the same as in Fig. 10. Lower panel: blackbody radius Rbb for each spectral slice, superimposed to the profiles of the 27 QPEs (gray thick lines) with spectral analysis available.
Current usage metrics show cumulative count of Article Views (full-text article views including HTML views, PDF and ePub downloads, according to the available data) and Abstracts Views on Vision4Press platform.
Data correspond to usage on the plateform after 2015. The current usage metrics is available 48-96 hours after online publication and is updated daily on week days.
Initial download of the metrics may take a while.