Fig. 5.
Download original image
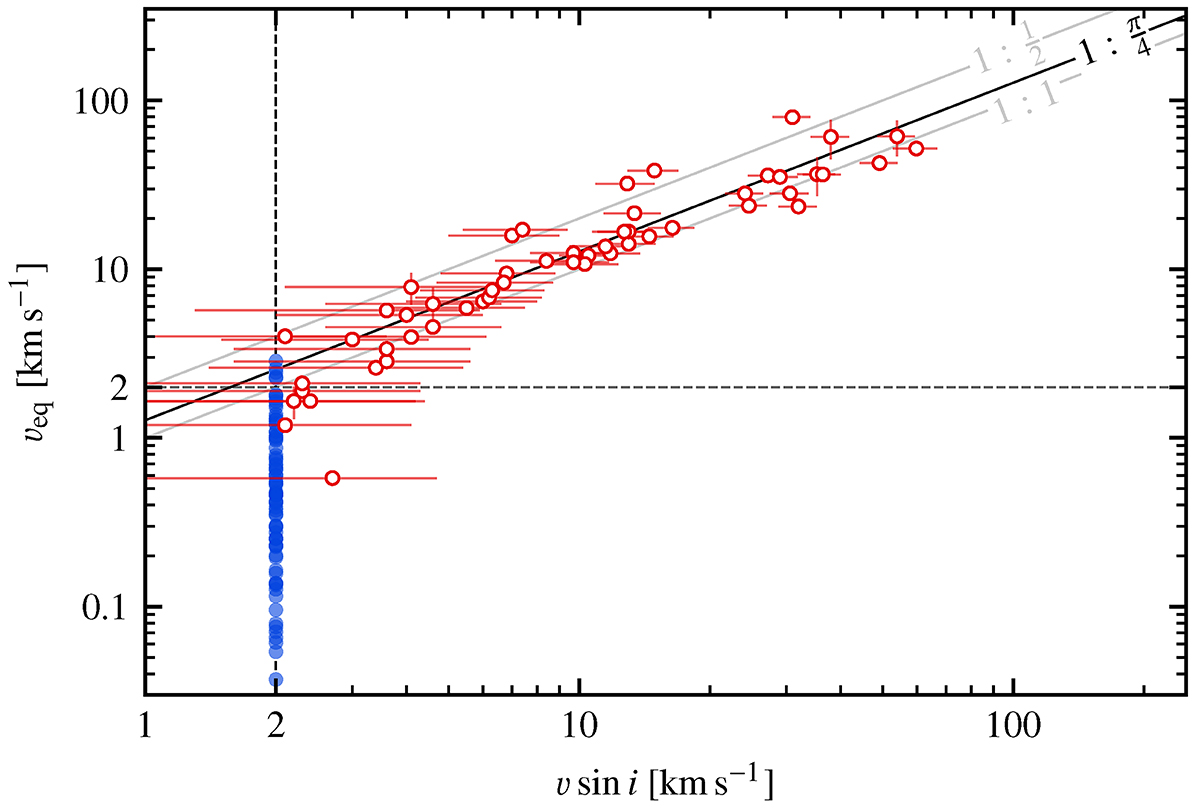
Equatorial vs. projected rotation velocity. veq is derived from the stellar radius and rotation period, and v sin i originates from fitting the rotational line broadening. The blue dots display stars with an upper limit on v sin i, and red circles show stars with nominal values for v sin i. The dashed lines indicate 2 km s−1 in v sin i and veq. The linear ![]() relation (solid black line) corresponds to the expected value of sin i for an isotropic distribution of the inclination angles (see Appendix B). The relations 1 : 1 and
relation (solid black line) corresponds to the expected value of sin i for an isotropic distribution of the inclination angles (see Appendix B). The relations 1 : 1 and ![]() corresponding to i = 90° and
corresponding to i = 90° and ![]() ° are shown for comparison (solid gray lines).
° are shown for comparison (solid gray lines).
Current usage metrics show cumulative count of Article Views (full-text article views including HTML views, PDF and ePub downloads, according to the available data) and Abstracts Views on Vision4Press platform.
Data correspond to usage on the plateform after 2015. The current usage metrics is available 48-96 hours after online publication and is updated daily on week days.
Initial download of the metrics may take a while.