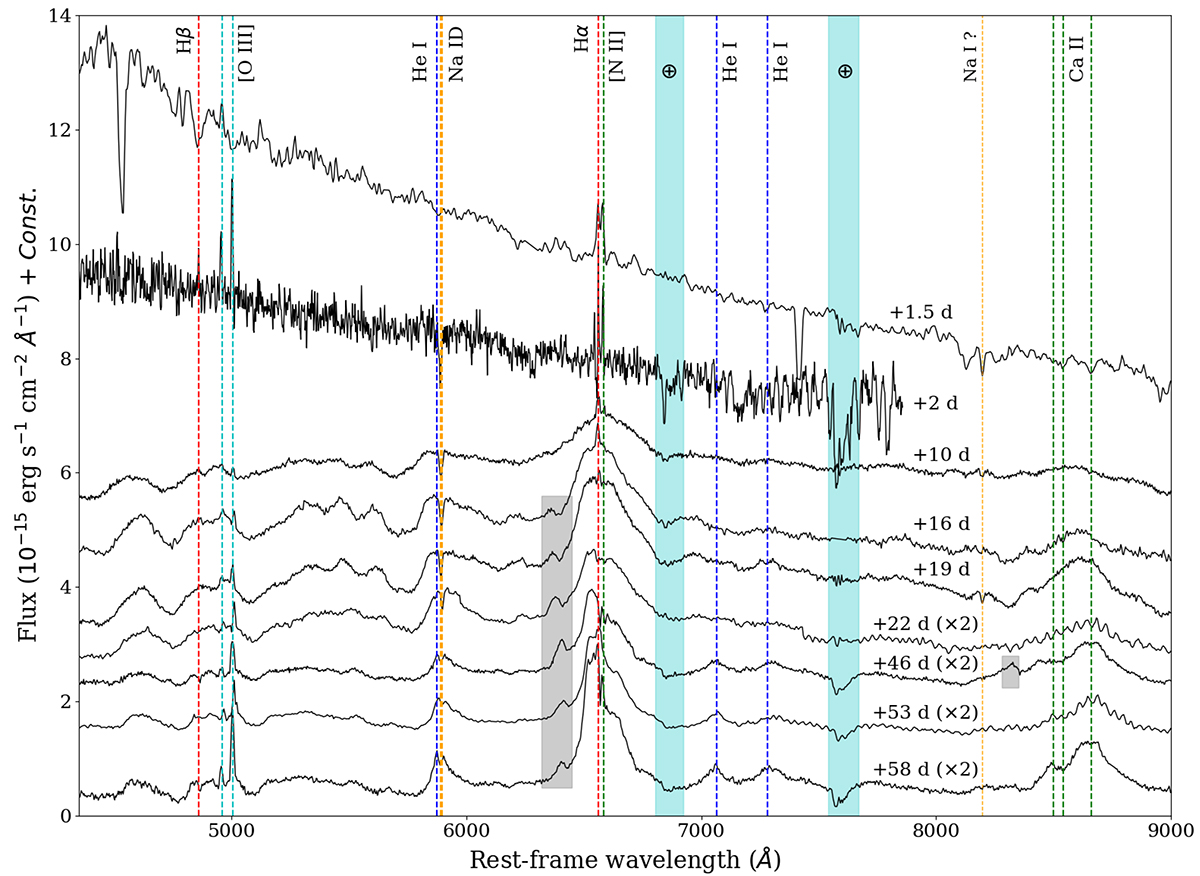
Fig. 6.
Download original image
Spectral sequence of SN 2018ivc, spanning two months of evolution after the discovery. The phases relative to the explosion are reported. The spectra have been corrected for redshift and Milky Way extinction only, as the host galaxy reddening is highly uncertain. The principal identified transitions are highlighted with vertical dashed lines. The possible high velocity feature discussed in Sect. 5.2 is also marked in gray. Each spectrum is shifted by a constant for graphical purposes. The regions most affected by the telluric absorption bands are marked in cyan.
Current usage metrics show cumulative count of Article Views (full-text article views including HTML views, PDF and ePub downloads, according to the available data) and Abstracts Views on Vision4Press platform.
Data correspond to usage on the plateform after 2015. The current usage metrics is available 48-96 hours after online publication and is updated daily on week days.
Initial download of the metrics may take a while.