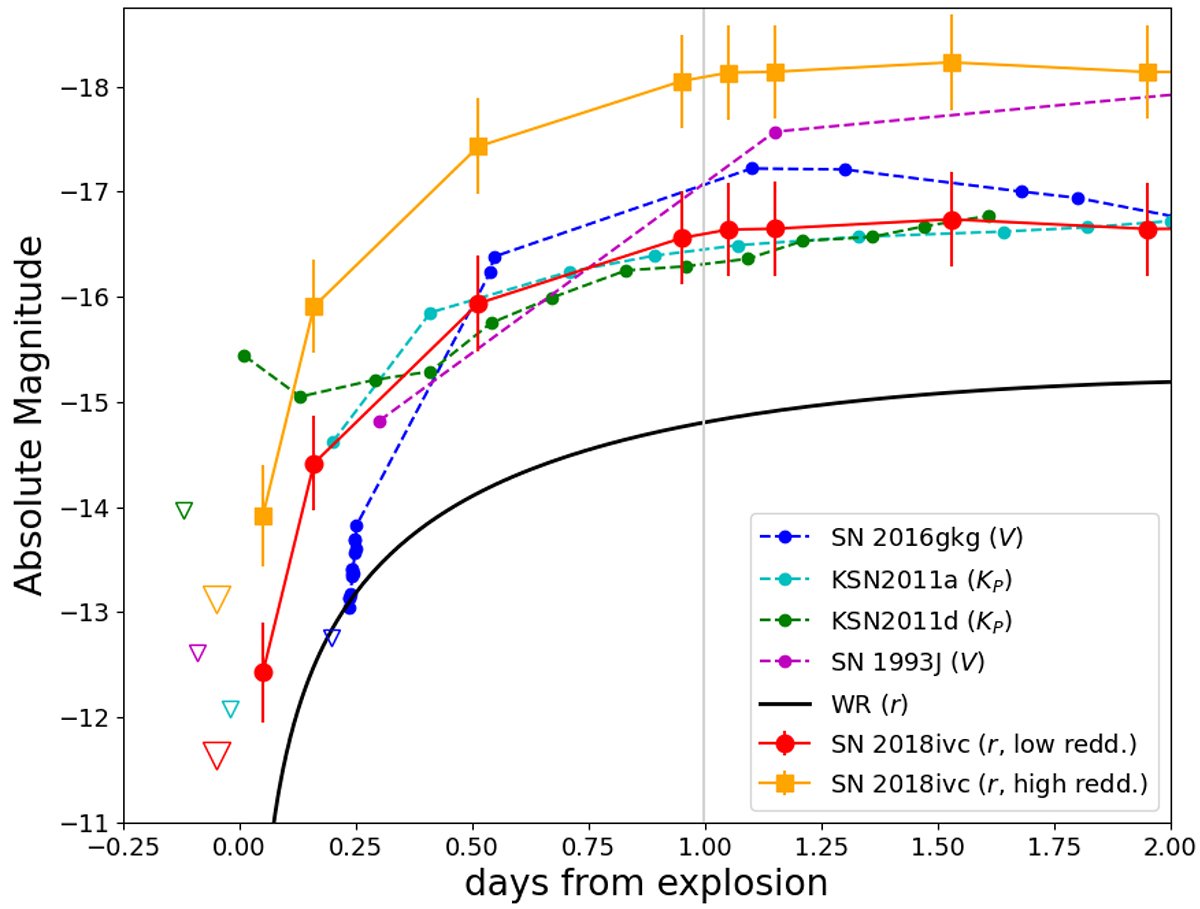
Fig. 5.
Download original image
Comparison of the absolute light curves of SNe 2018ivc, 1993J, 2016gkg (adopting the explosion epoch from Arcavi et al. 2017), KSN2011a, and KSN2011d in the first two days after the explosion. For SN 2018ivc, the Clear (calibrated as r-band) magnitudes are plotted, for SNe 1993J and 2016gkg the V-band and for the two Kepler’s SNe the KP-filter ones. For SN 2018ivc, the error bars are also plotted, summing in quadrature the errors from the photometric measurements, the μ and the internal reddening. Both the low and high host reddening scenarios are considered. The official discovery date of SN 2018ivc is marked with a vertical line. The downward triangles mark the last non-detection of each SN. The absolute r-band light curve following the SBO from a typical Wolf-Rayet model (M = 5 M⊙, R = 10 R⊙, Eexpl = 1 foe) of Nakar & Sari (2010) is also plotted (black line).
Current usage metrics show cumulative count of Article Views (full-text article views including HTML views, PDF and ePub downloads, according to the available data) and Abstracts Views on Vision4Press platform.
Data correspond to usage on the plateform after 2015. The current usage metrics is available 48-96 hours after online publication and is updated daily on week days.
Initial download of the metrics may take a while.