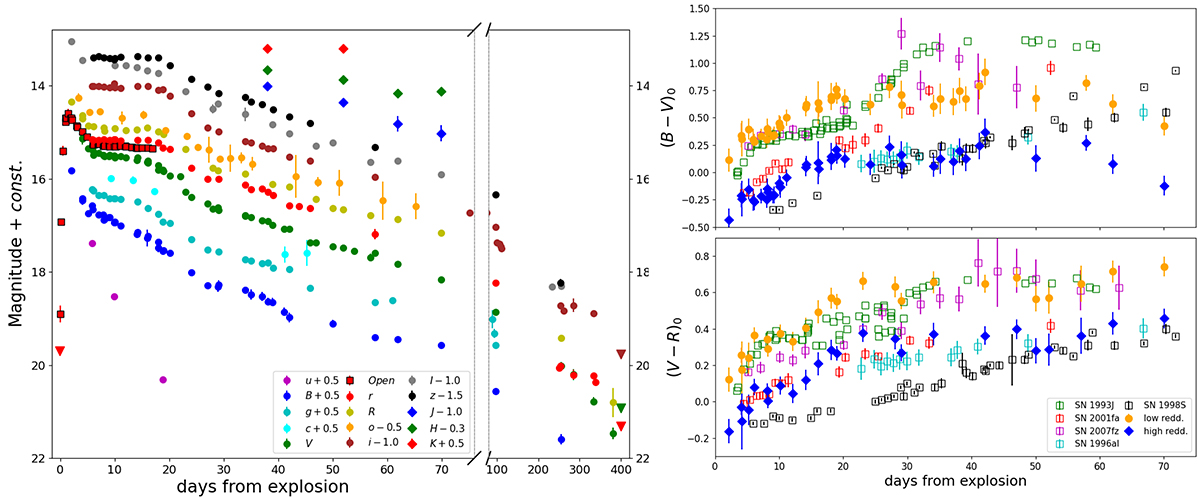
Fig. 4.
Download original image
Open, JC BVRI, Sloan ugriz, ATLAS c, o and NIR JHK light curves (left) over the one-year follow-up of SN 2018ivc. The graph has been broken into two windows (before and after +3 months) for clarity. Downward triangles mark upper limits. B − V and V − R reddening-corrected colour curves (right) of SN 2018ivc (filled points) and of the comparison objects: SNe 1993J, 2001fa, 2007fz, 1996al, and 1998S. For SN 2018ivc, we considered both the low (orange circles) and high (blue diamonds) reddening scenarios (see Sect. 4.4).
Current usage metrics show cumulative count of Article Views (full-text article views including HTML views, PDF and ePub downloads, according to the available data) and Abstracts Views on Vision4Press platform.
Data correspond to usage on the plateform after 2015. The current usage metrics is available 48-96 hours after online publication and is updated daily on week days.
Initial download of the metrics may take a while.