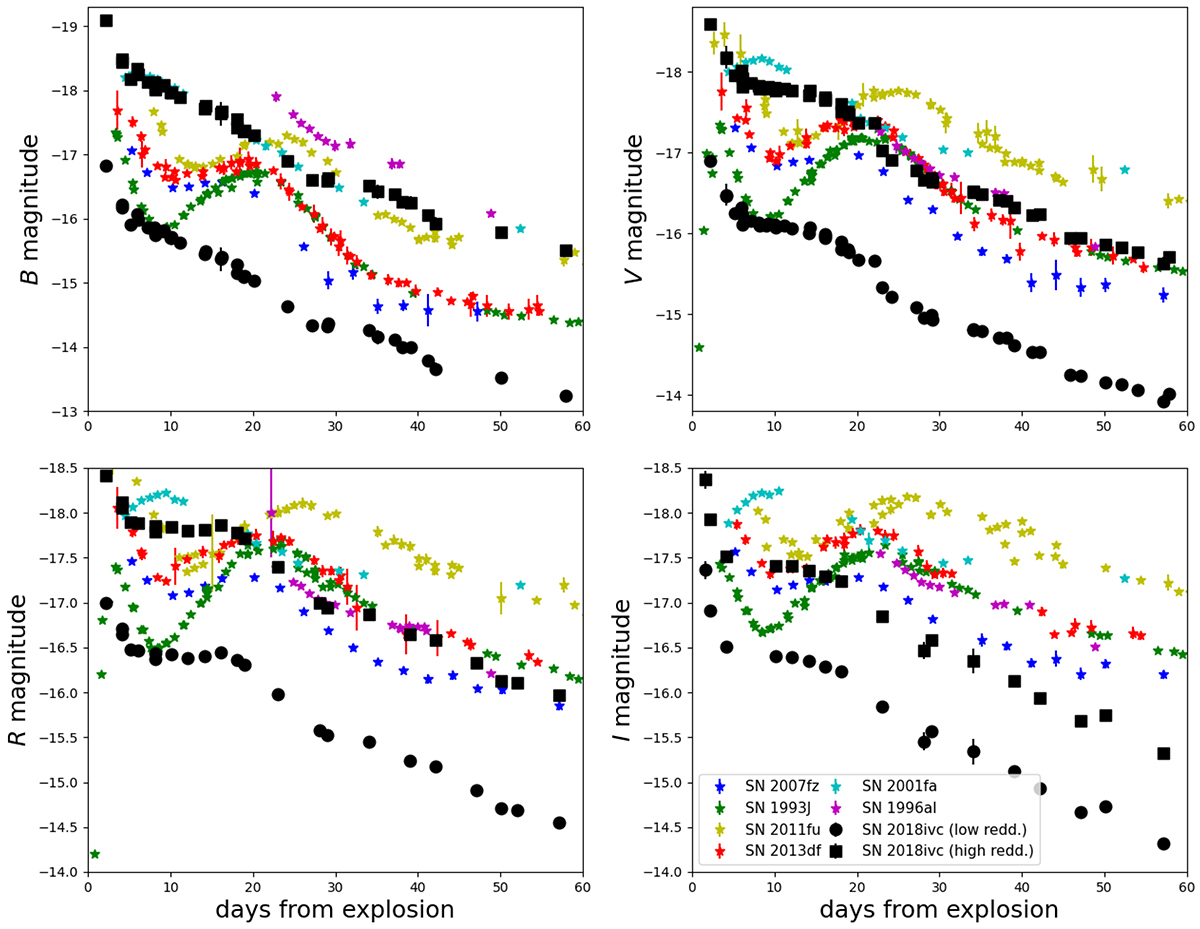
Fig. 12.

Download original image
Comparison between the BVRI absolute light curves of SNe 1993J, 2011fu and 2013df (IIb), 1996al (IIn), 2001fa and 2007fz (IIL), and 2018ivc up to 60 days after maximum. For SN 2018ivc, the absolute light curves for both the low and high reddening scenarios are plotted with circles and squares, respectively. SN 2007fz presents a well-defined secondary peak between one and two weeks after maximum, while SN 2018ivc shows a short plateau. The two objects have quite similar photometric evolution.
Current usage metrics show cumulative count of Article Views (full-text article views including HTML views, PDF and ePub downloads, according to the available data) and Abstracts Views on Vision4Press platform.
Data correspond to usage on the plateform after 2015. The current usage metrics is available 48-96 hours after online publication and is updated daily on week days.
Initial download of the metrics may take a while.


