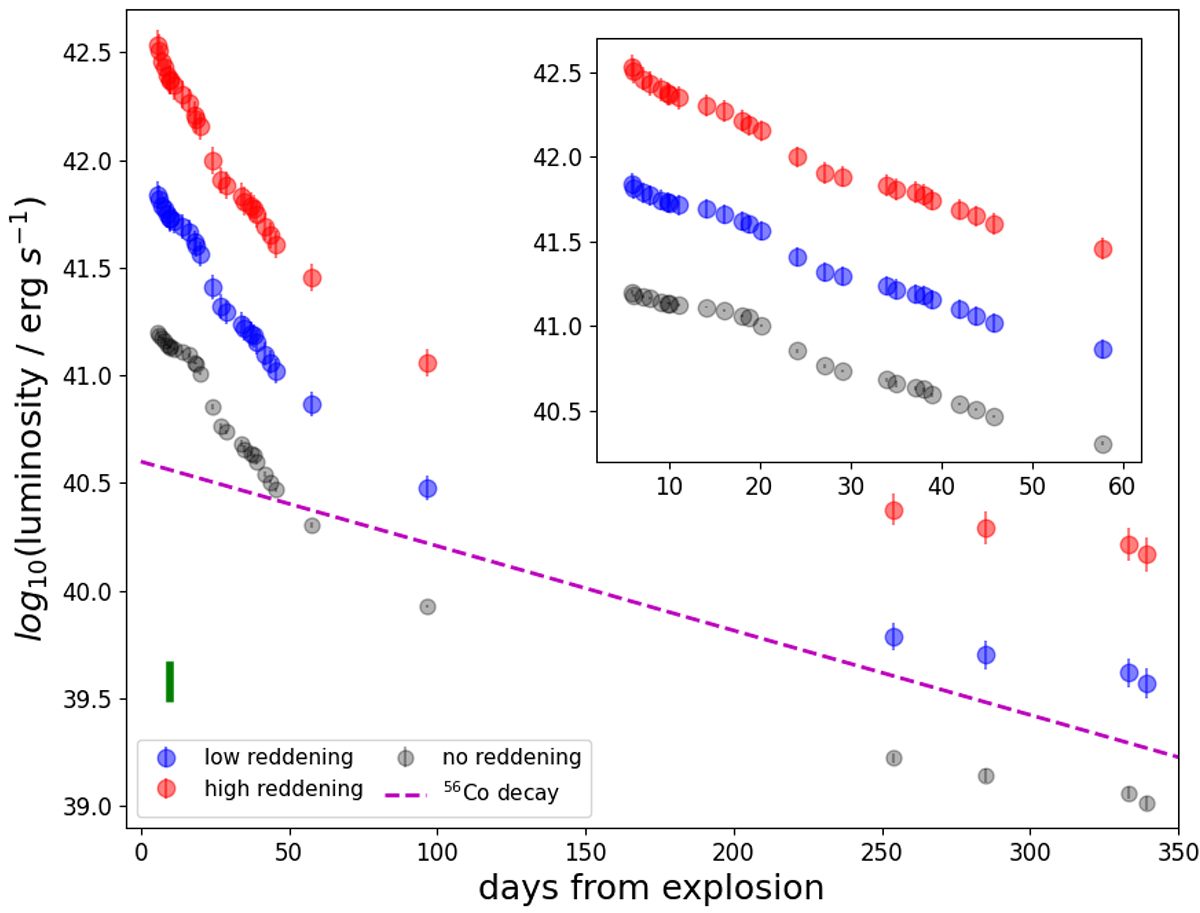
Fig. 11.
Download original image
Pseudo-bolometric uBgVrRiIz light curves of SN 2018ivc, for both the low and high reddening scenarios. The inset shows a blow-up of the first two months after the explosion. For reference, we plot also the pseudo-bolometric light curve without any correction for reddening in black; the short plateau feature is more pronounced. The decay slope of 56Co (0.98 mag (100 d)−1) is reported with a dashed purple line for comparison. At late phases (after +100 days) the evolution of SN 2018ivc is close to being powered by the 56Co decay. The systematic error bar due to the uncertainty on the distance is reported in the bottom-left corner.
Current usage metrics show cumulative count of Article Views (full-text article views including HTML views, PDF and ePub downloads, according to the available data) and Abstracts Views on Vision4Press platform.
Data correspond to usage on the plateform after 2015. The current usage metrics is available 48-96 hours after online publication and is updated daily on week days.
Initial download of the metrics may take a while.