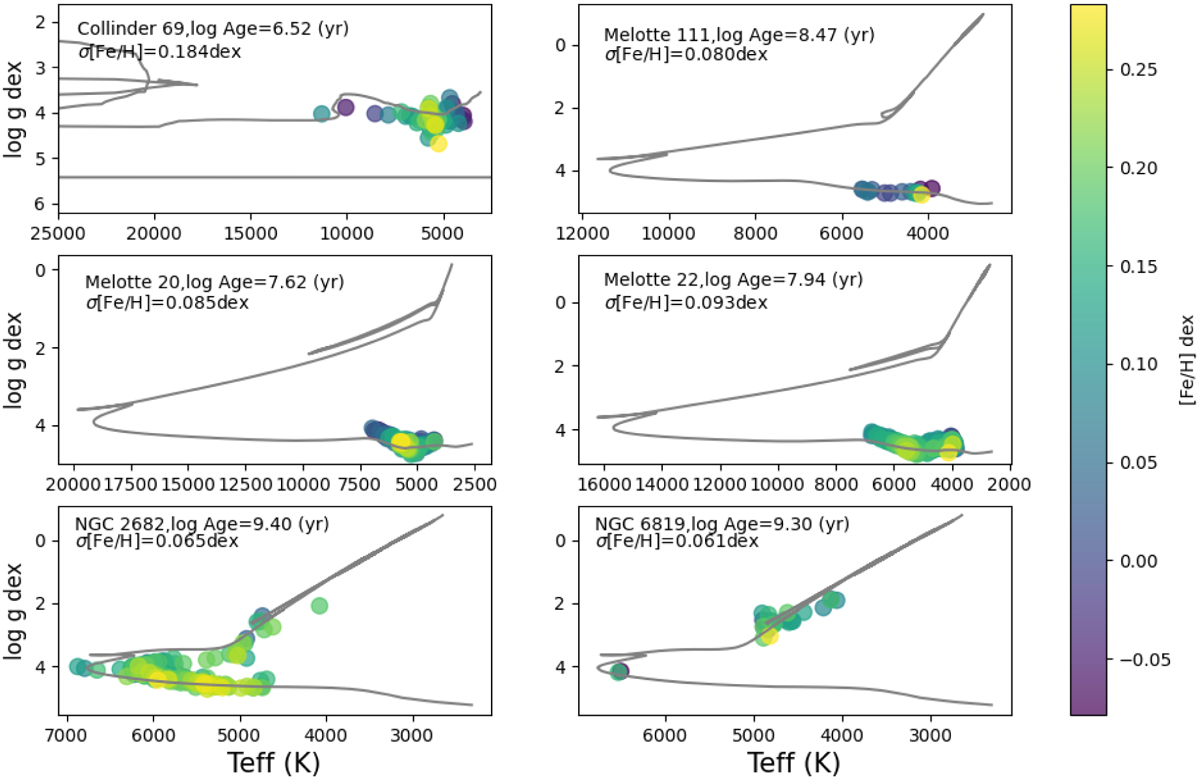
Fig. 7
Download original image
Kiel diagram displaying the member distribution for six selected OCs, color-coded according to metallicity. The x-axis corresponds to the effective temperature, while the y-axis corresponds to the surface gravity. The gray dashed track represents the PARSEC isochrone, which is based on the OC parameters from Cavallo et al. (2024).
Current usage metrics show cumulative count of Article Views (full-text article views including HTML views, PDF and ePub downloads, according to the available data) and Abstracts Views on Vision4Press platform.
Data correspond to usage on the plateform after 2015. The current usage metrics is available 48-96 hours after online publication and is updated daily on week days.
Initial download of the metrics may take a while.