Fig. 5
Download original image
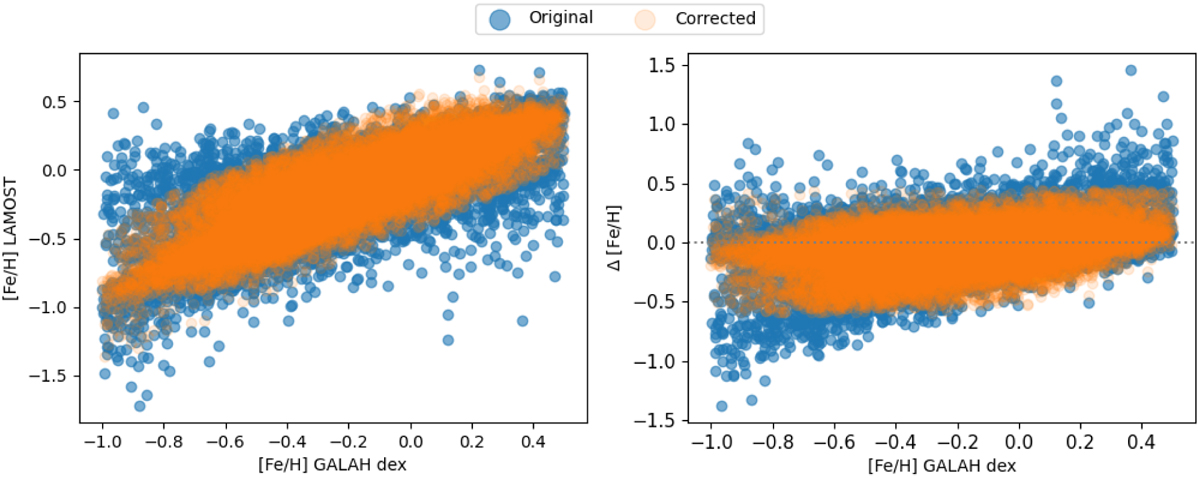
Comparison of Metallicity Measurements from LAMOST DR8 and GALAH. The right panel shows the iron relation for 30 000 targets. The y-axis represents the metallicity from LAMOST dr8, while the x-axis represents the corresponding value from GALAH. The left plot displays the metallicity residuals of LAMOST and GALAH, both before and after correction. The blue dots represent the original data selected from LAMOST DR8, while the orange dot represents the LAMOST result after correction.
Current usage metrics show cumulative count of Article Views (full-text article views including HTML views, PDF and ePub downloads, according to the available data) and Abstracts Views on Vision4Press platform.
Data correspond to usage on the plateform after 2015. The current usage metrics is available 48-96 hours after online publication and is updated daily on week days.
Initial download of the metrics may take a while.