Fig. 2
Download original image
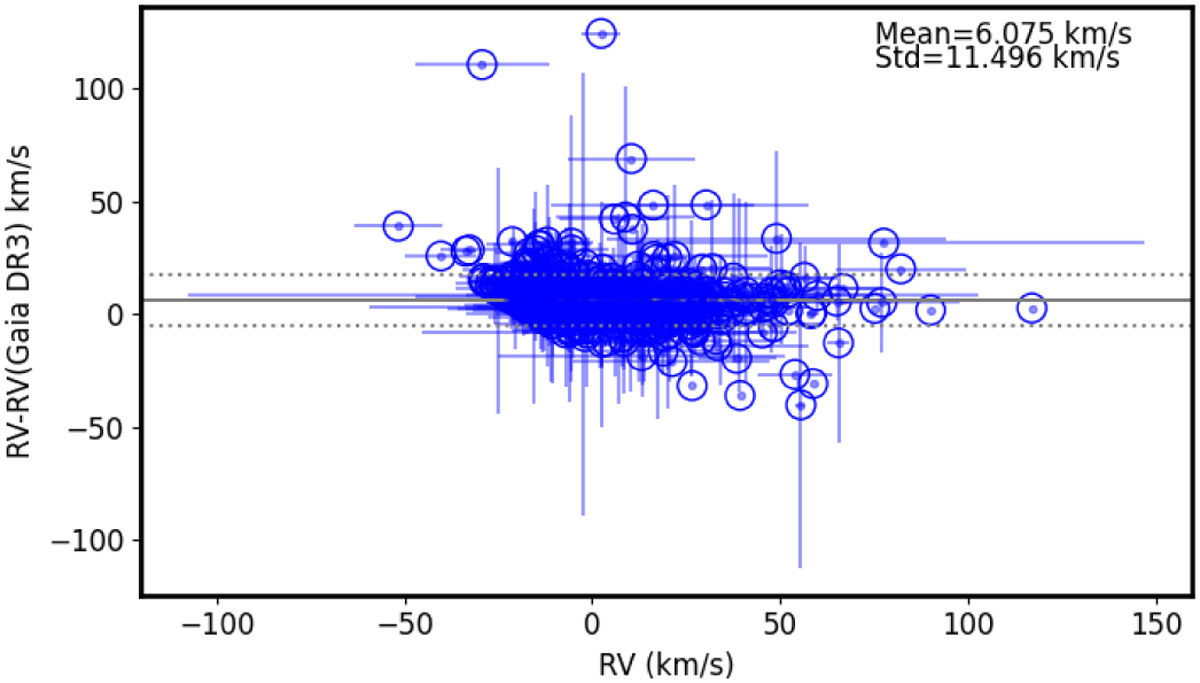
Difference distribution in RVs for 595 cross-matching targets between Gaia DR3 and the present study. The mean value of the offset is 6.075 with a standard deviation of 11.496 km s−1 as indicated by the gray lines in the plot. The x-axis represents the LAMOST RV and the error of the overlapped sample. The y-axis includes the RV uncertainties from Gaia DR3.
Current usage metrics show cumulative count of Article Views (full-text article views including HTML views, PDF and ePub downloads, according to the available data) and Abstracts Views on Vision4Press platform.
Data correspond to usage on the plateform after 2015. The current usage metrics is available 48-96 hours after online publication and is updated daily on week days.
Initial download of the metrics may take a while.