Fig. B1
Download original image
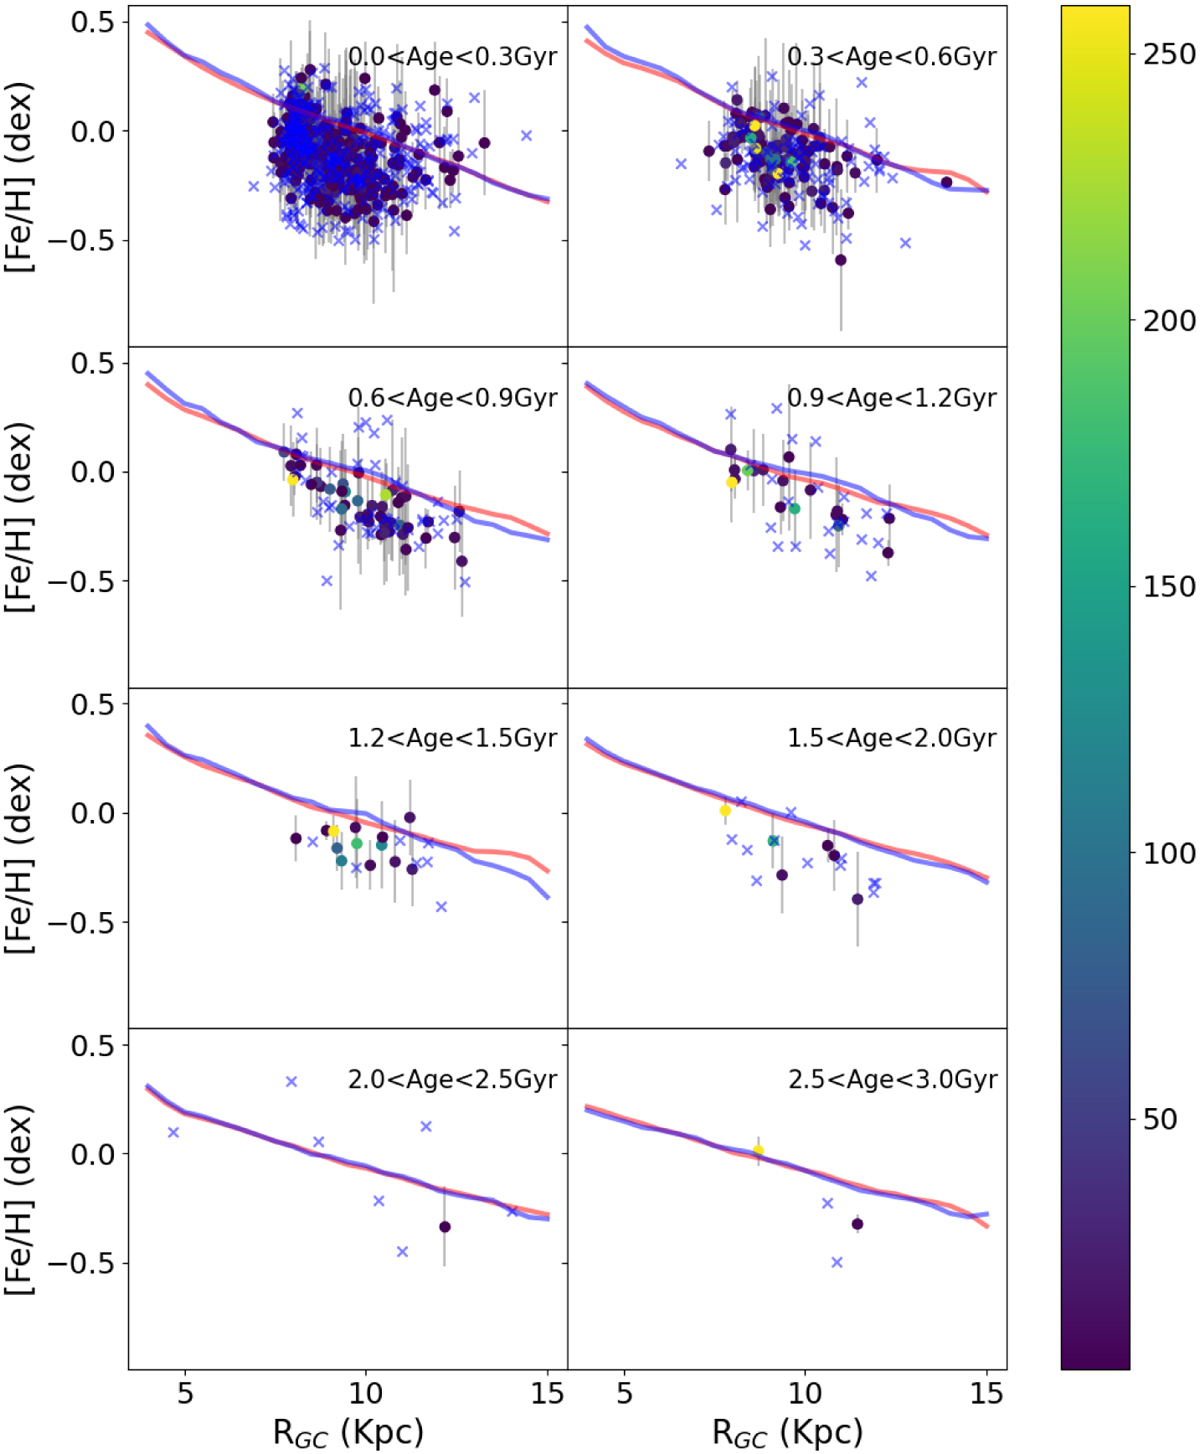
Comparison between chemo-dynamic model (Minchev et al. 2014a,b) and observation for clusters younger than 3Gyr. The red lines and the blue lines are predictions from the MCM models for |z| < 0.3 kpc and 0.3 < |z| <0.8 kpc respectively. The colors in the cycle are the number of stars for each OC whose membership is larger than 3, and the cross symbol is the OC with a member less than 3.
Current usage metrics show cumulative count of Article Views (full-text article views including HTML views, PDF and ePub downloads, according to the available data) and Abstracts Views on Vision4Press platform.
Data correspond to usage on the plateform after 2015. The current usage metrics is available 48-96 hours after online publication and is updated daily on week days.
Initial download of the metrics may take a while.