Fig. 15
Download original image
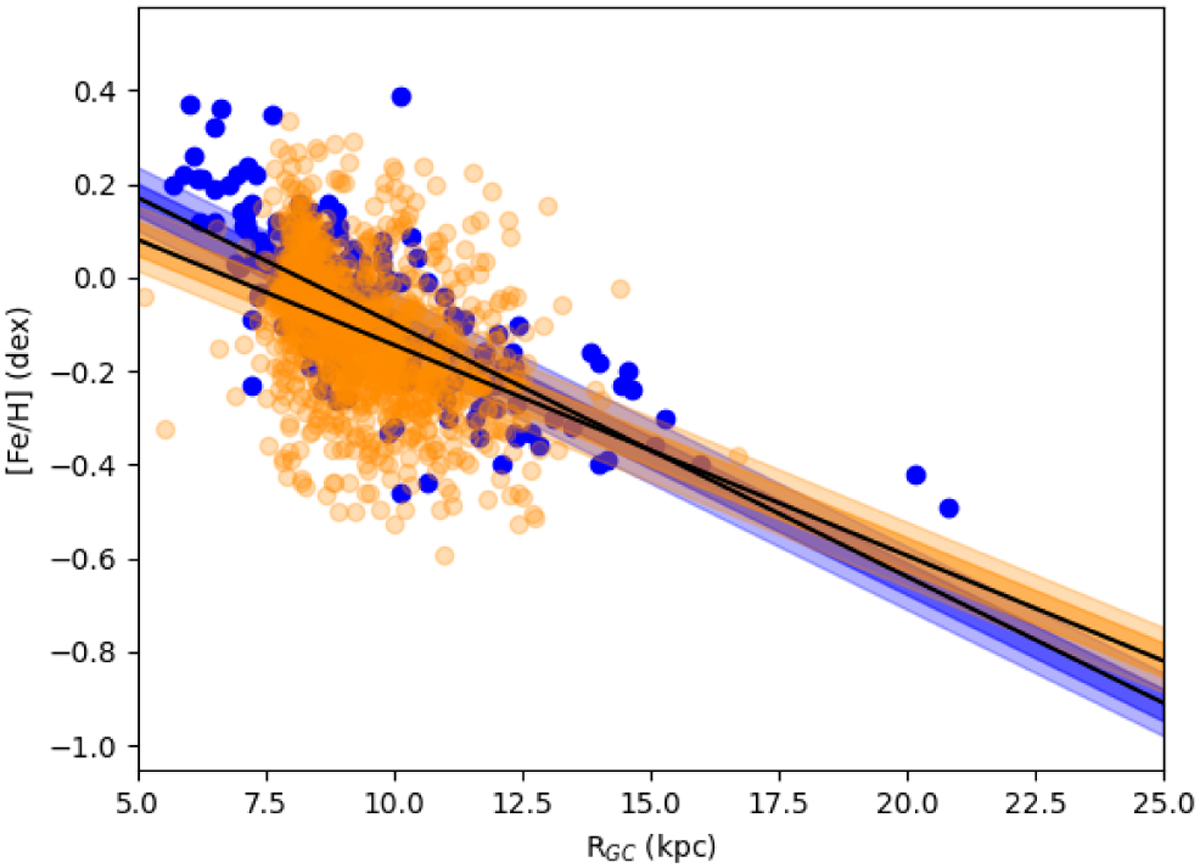
Metallicity distribution as a function of galactocentric distance for OCs of all ages. The orange dots represent the sample from this work, while the blue points represent OCs selected from the literature where HRS was used to determine metallicity. The linear regression models for the present samples are shown in dark orange and orange, representing the 68% and 95% confidence intervals, respectively. Similarly, the confidence intervals for the literature samples are shown in dark blue and blue, representing the 68% and 95% confidence intervals, respectively.
Current usage metrics show cumulative count of Article Views (full-text article views including HTML views, PDF and ePub downloads, according to the available data) and Abstracts Views on Vision4Press platform.
Data correspond to usage on the plateform after 2015. The current usage metrics is available 48-96 hours after online publication and is updated daily on week days.
Initial download of the metrics may take a while.