Fig. 13
Download original image
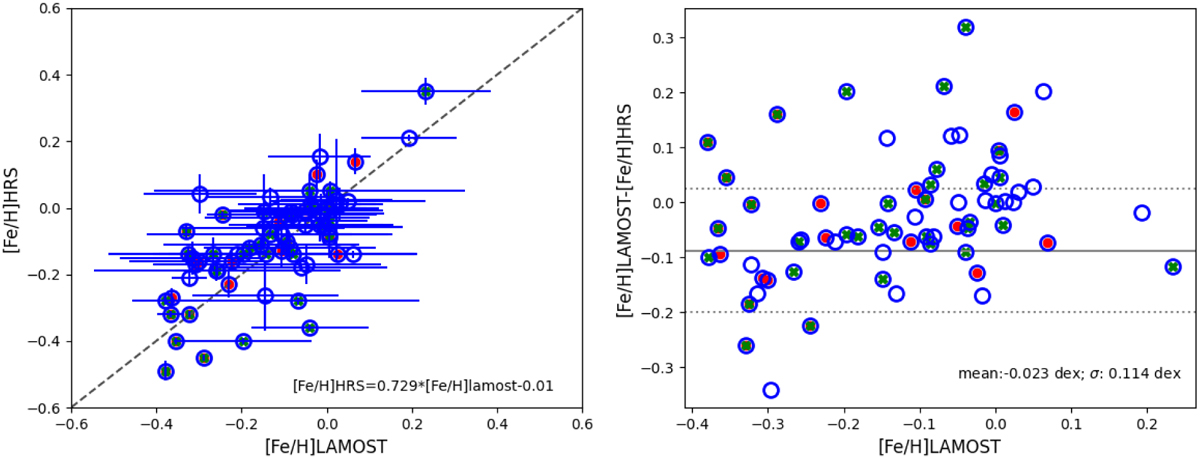
Comparison of [Fe/H] Distribution between LAMOST and HRS Data. Left panel: distribution of [Fe/H] for both our results and results from the literature based on HRS. The metallicities from these two datasets follow the function [Fe/H]HRS = 0·729[Fe/H]LAMOST − 0.01. The dashed line represents a 1:1 linear relationship. Right panel: residual metallicities between the two datasets, with an average difference of −0.0023±0.114 dex. The red circles represent clusters with fewer than three members in the LAMOST data, while the green crosses represent HRS OCs with fewer than three members.
Current usage metrics show cumulative count of Article Views (full-text article views including HTML views, PDF and ePub downloads, according to the available data) and Abstracts Views on Vision4Press platform.
Data correspond to usage on the plateform after 2015. The current usage metrics is available 48-96 hours after online publication and is updated daily on week days.
Initial download of the metrics may take a while.