Fig. 10
Download original image
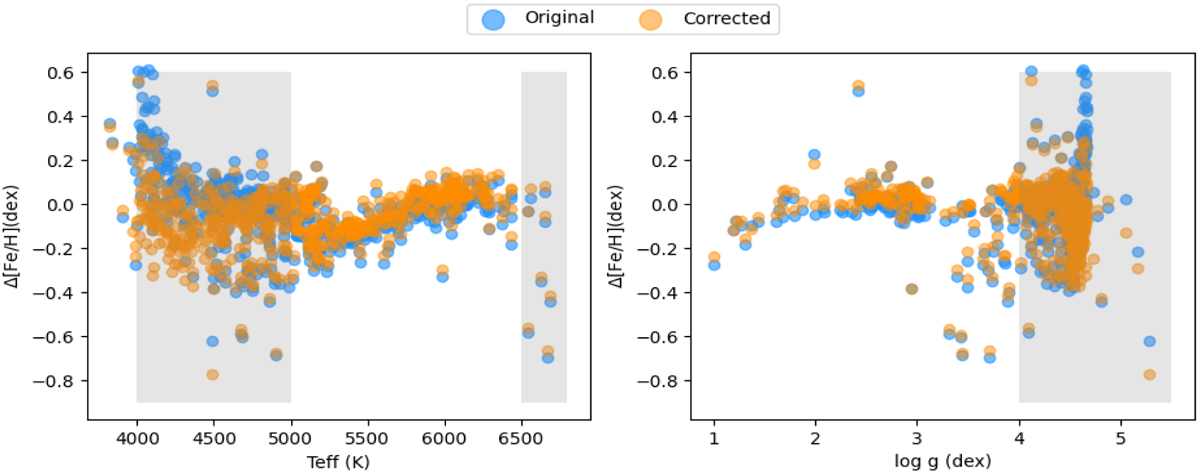
Residuals between APOGEE DR17 and LAMOST LRS calculated based on the effective temperature and surface gravity. The blue dots represent the difference between HRS and the original LRS result, while the orange curve shows the difference between HRS and LRS after correction. The gray-shaded region includes samples with an effective temperature of below 5000 K or above 6500 K and dwarfs with a surface gravity of around 4.5 dex.
Current usage metrics show cumulative count of Article Views (full-text article views including HTML views, PDF and ePub downloads, according to the available data) and Abstracts Views on Vision4Press platform.
Data correspond to usage on the plateform after 2015. The current usage metrics is available 48-96 hours after online publication and is updated daily on week days.
Initial download of the metrics may take a while.