Fig. 1
Download original image
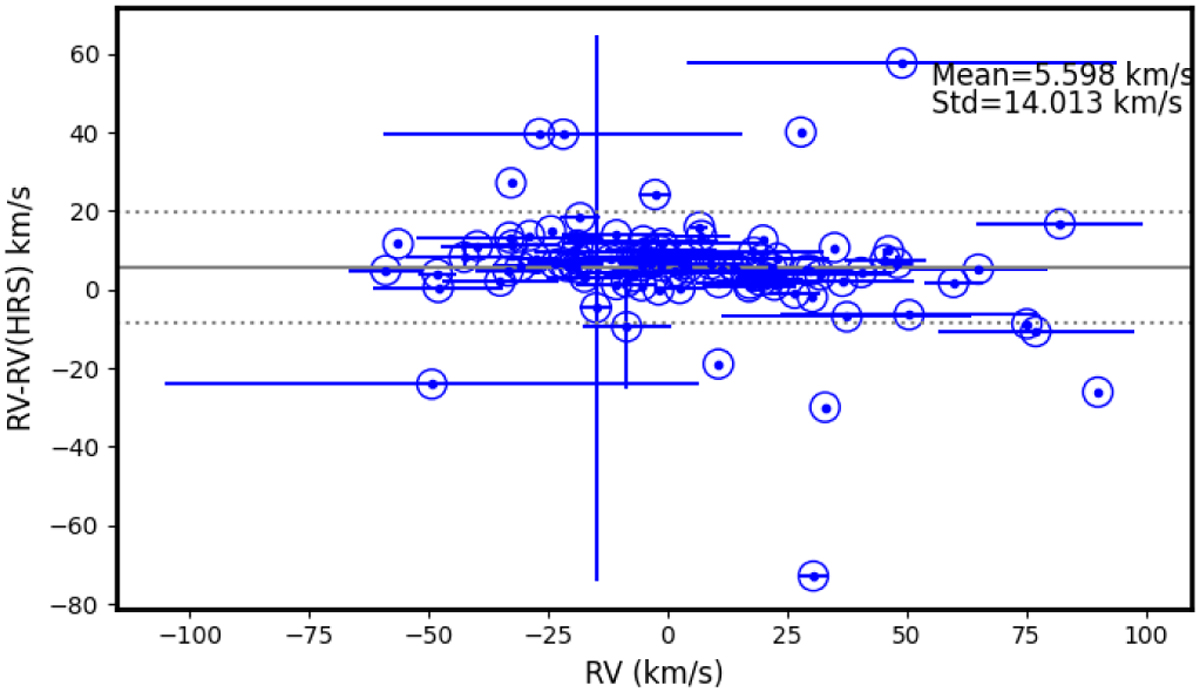
Difference in RVs between 101 cross-matched targets from previous works, including those by Casali et al. (2019), Casamiquela et al. (2016), Spina et al. (2021), Frasca et al. (2019), Casali et al. (2020), D’Orazi et al. (2020), Zhang et al. (2021a), and Carrera et al. (2022), and the current study is shown. The gray lines indicate the mean offset value of 5.598 km/s with a standard deviation of 14.013 km/s for this comparison. The x-axis represents the RV of the present study, incorporating the error for the overlapping sample.
Current usage metrics show cumulative count of Article Views (full-text article views including HTML views, PDF and ePub downloads, according to the available data) and Abstracts Views on Vision4Press platform.
Data correspond to usage on the plateform after 2015. The current usage metrics is available 48-96 hours after online publication and is updated daily on week days.
Initial download of the metrics may take a while.