Open Access
Fig. 6.
Download original image
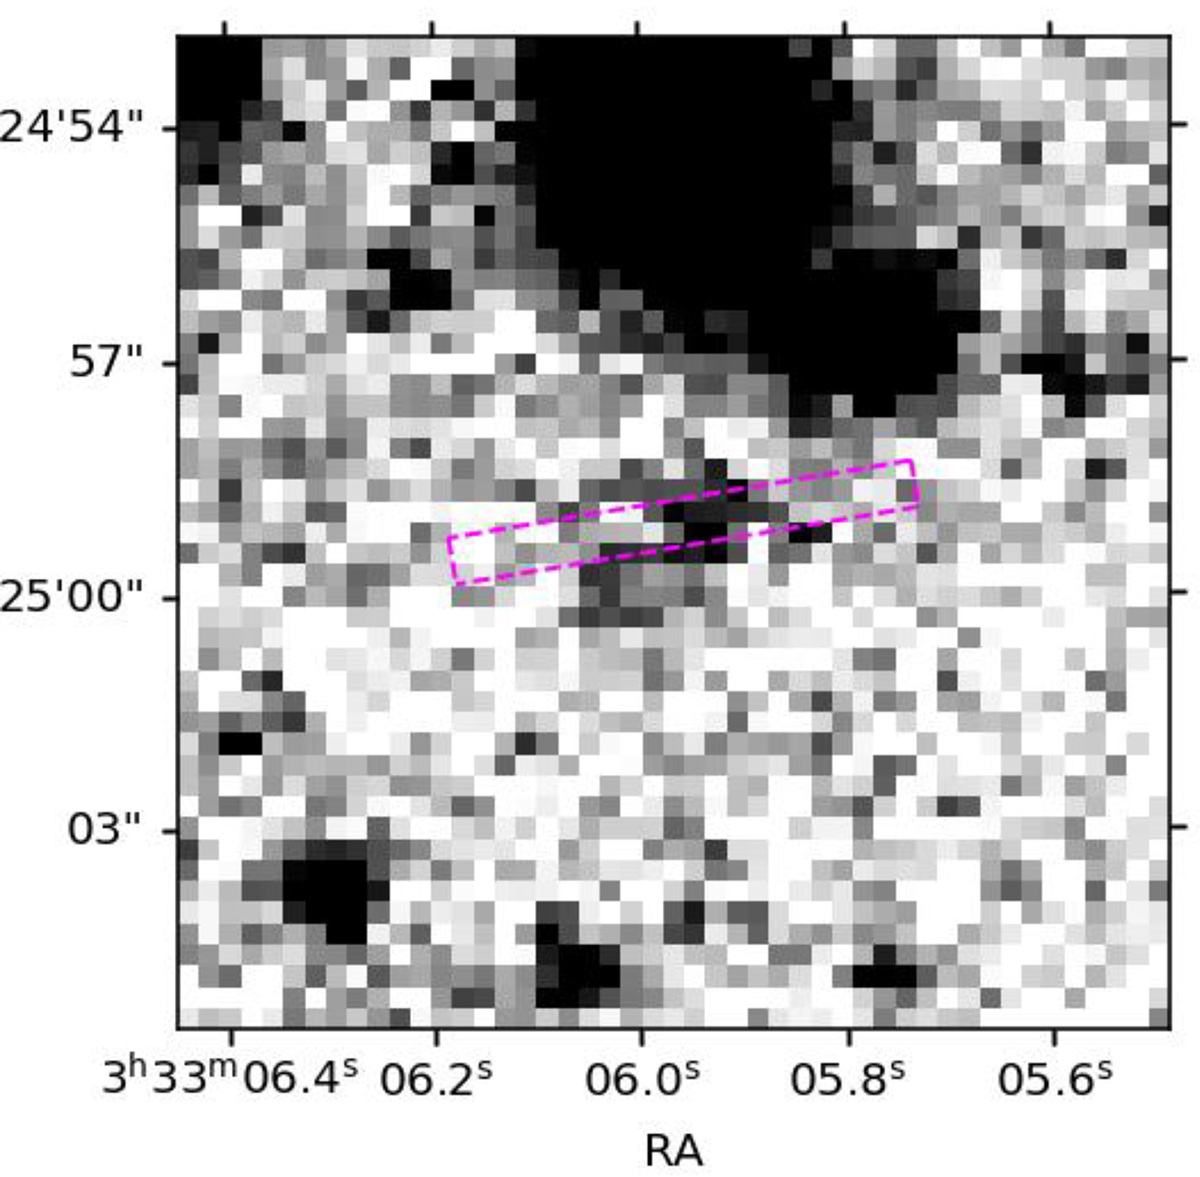
DECam z-band image of CDFS1. We overlay the slit as done in Fig. 1. The morphology appears clumpy. Though one of the components falls outside of the slit, the Lyα-emitting region does not need to be co-spatial with the continuum emitting region.
Current usage metrics show cumulative count of Article Views (full-text article views including HTML views, PDF and ePub downloads, according to the available data) and Abstracts Views on Vision4Press platform.
Data correspond to usage on the plateform after 2015. The current usage metrics is available 48-96 hours after online publication and is updated daily on week days.
Initial download of the metrics may take a while.