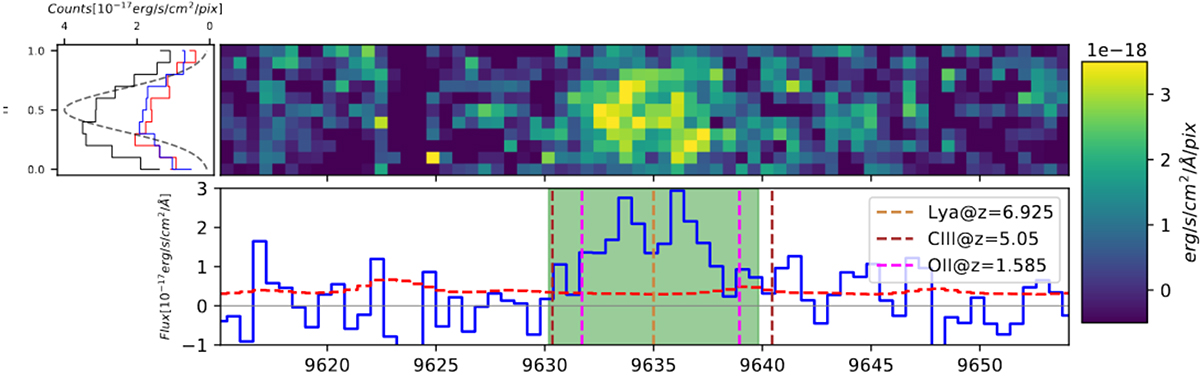
Fig. 2.
Download original image
1D and 2D FIRE spectra Top: Five hours of combined 2D spectra centered around the Lyα line. Bottom: Extracted 1D spectra. We sum all the flux within the columns. We also plot the expected positions of the [OII] and CIII] doublets to show that these lines are not the origin of the observed double peak. Left: Spatial profile of the emission line. We integrate the flux within the shaded region. We also plot only flux integrated blueward (blue) and redward (red) of 9635 Å.
Current usage metrics show cumulative count of Article Views (full-text article views including HTML views, PDF and ePub downloads, according to the available data) and Abstracts Views on Vision4Press platform.
Data correspond to usage on the plateform after 2015. The current usage metrics is available 48-96 hours after online publication and is updated daily on week days.
Initial download of the metrics may take a while.