Fig. 2
Download original image
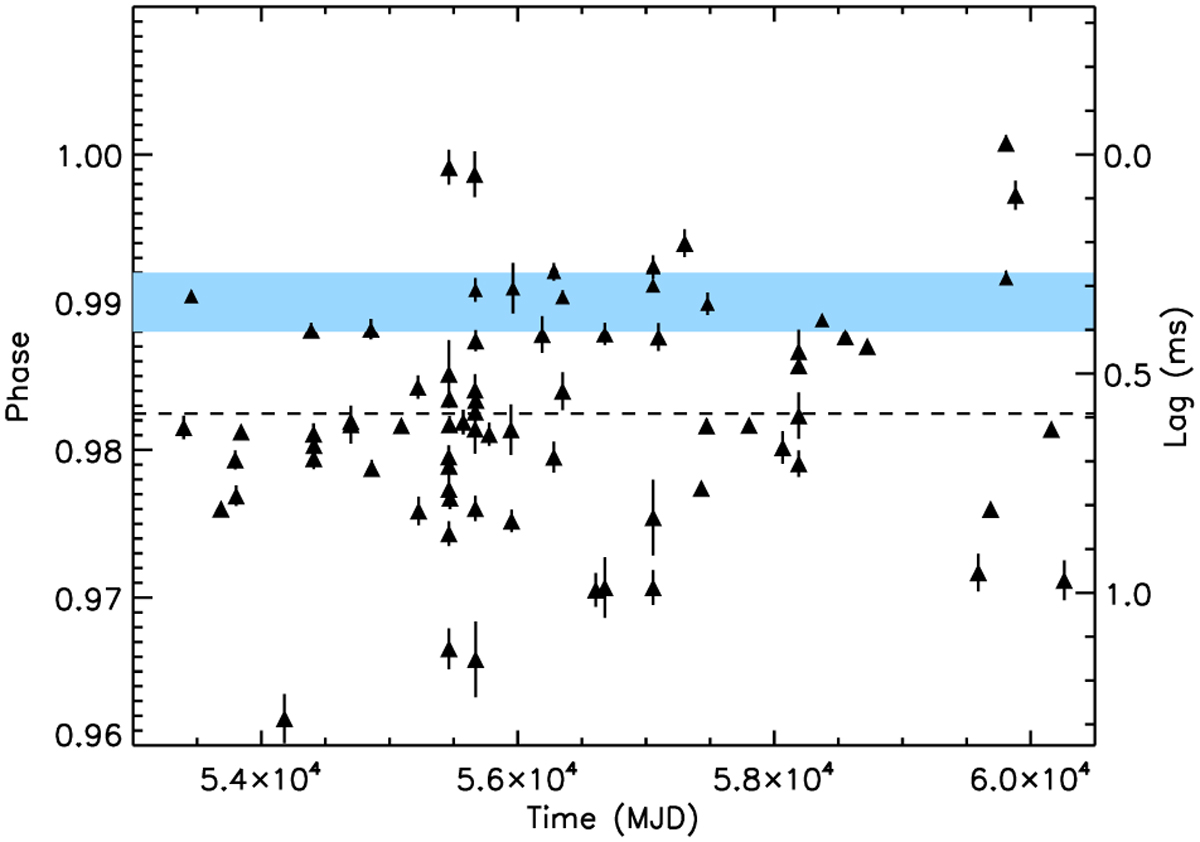
Phase position of the Crab pulsar main peak. The right axis represents the phase delay in ms derived using a radio period of 33.7 ms (averaged over the data set). The dashed line represents the position of the main peak averaged over the entire dataset. The shaded strip centred at 0.9898 marks the phase range where the main peak is measured by RXTE (Rots et al. 2004), with its width dominated by a systematic uncertainty of 0.0012.
Current usage metrics show cumulative count of Article Views (full-text article views including HTML views, PDF and ePub downloads, according to the available data) and Abstracts Views on Vision4Press platform.
Data correspond to usage on the plateform after 2015. The current usage metrics is available 48-96 hours after online publication and is updated daily on week days.
Initial download of the metrics may take a while.