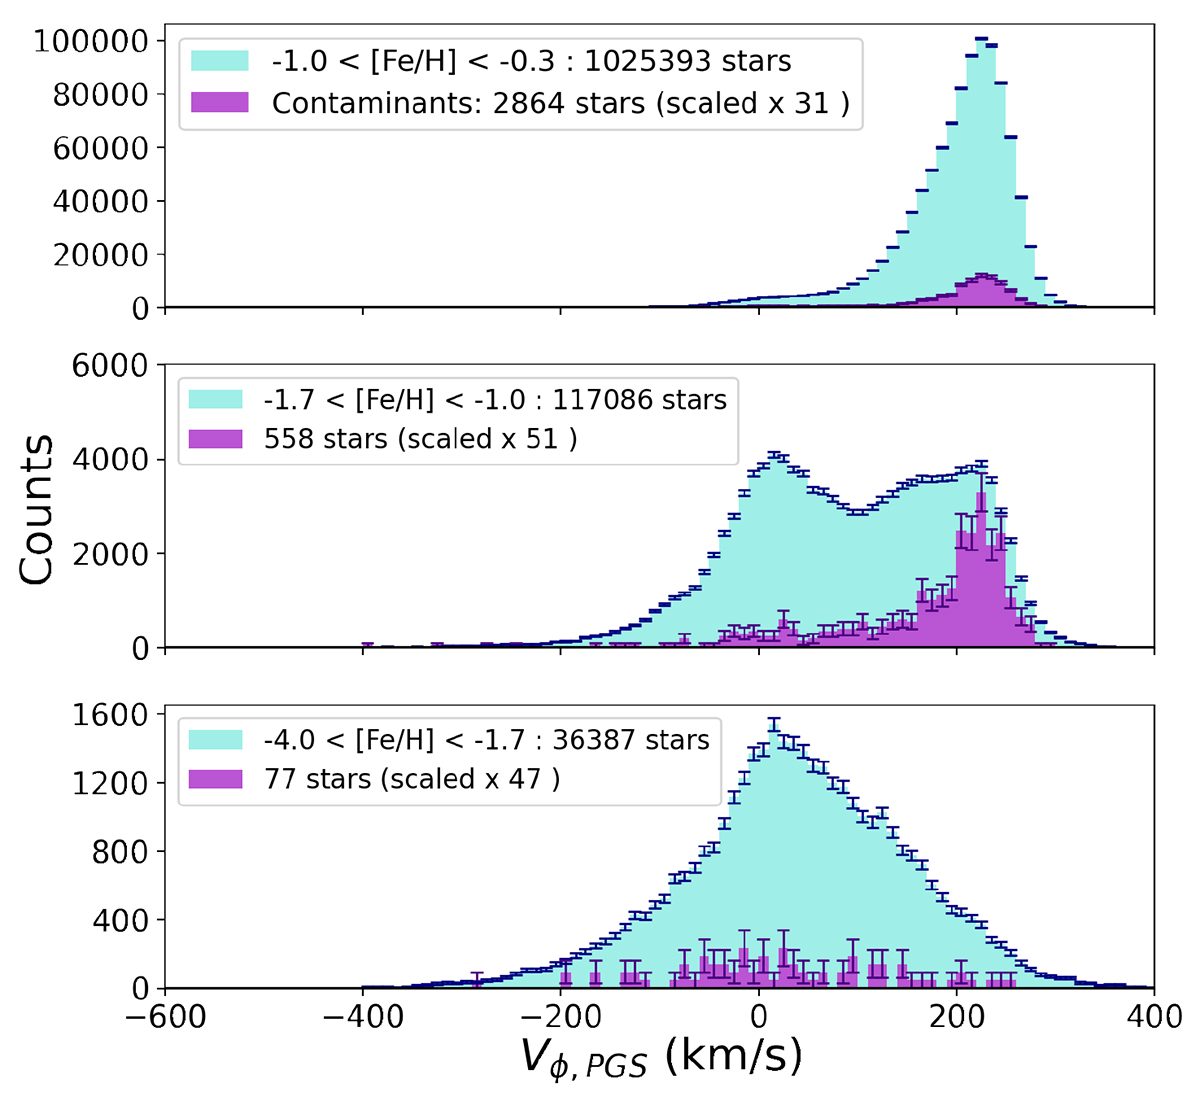
Fig. 6.
Download original image
Vϕ distribution of PGS. Counts with associated error bars (Poisson noise) are displayed in blue while PGS-APOGEE spectroscopic contaminants are displayed in purple. Contaminants are scaled by a factor equal to the size of PGS in each [Fe/H]PGS interval, divided by the size of APOGEE in the same intervals. Top panel: –1.0 < [Fe/H]PGS < –0.3. Middle panel: –1.7 < [Fe/H]PGS < –1.0. Bottom panel: –4.0 < [Fe/H]PGS < –1.7.
Current usage metrics show cumulative count of Article Views (full-text article views including HTML views, PDF and ePub downloads, according to the available data) and Abstracts Views on Vision4Press platform.
Data correspond to usage on the plateform after 2015. The current usage metrics is available 48-96 hours after online publication and is updated daily on week days.
Initial download of the metrics may take a while.