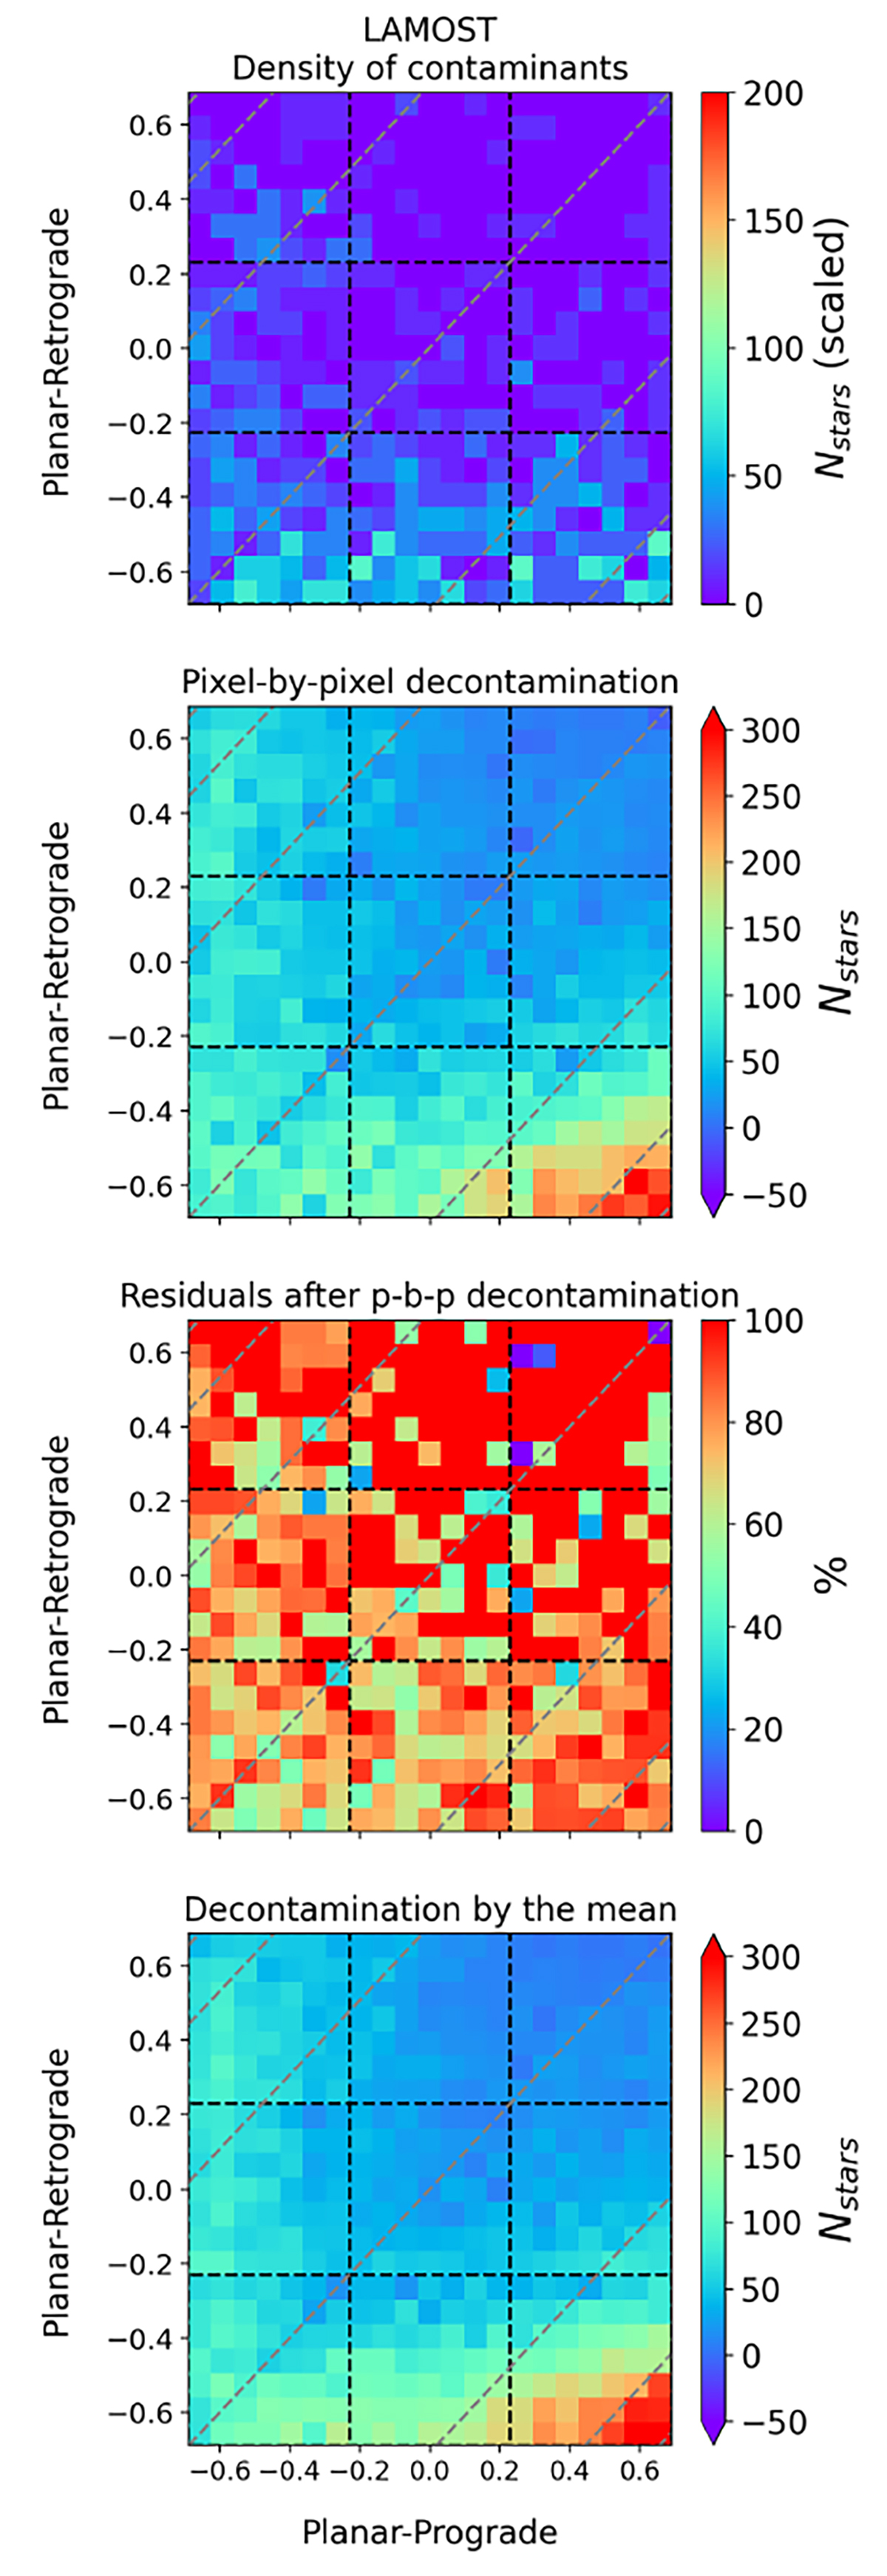
Fig. E.1.
Download original image
Densities in the action space. The grid corresponds to areas in the parameter space delimited in (Jz − Jr) and Lz. From top to bottom: first panel: density of LAMOST contaminants. Second panel: PGS decontaminated pixel-by-pixel, using LAMOST. Third panel: residuals percentages of the pixel-by-pixel PGS decontamination using LAMOST. Fourth panel: PGS decontaminated by the mean of the LAMOST contamination.
Current usage metrics show cumulative count of Article Views (full-text article views including HTML views, PDF and ePub downloads, according to the available data) and Abstracts Views on Vision4Press platform.
Data correspond to usage on the plateform after 2015. The current usage metrics is available 48-96 hours after online publication and is updated daily on week days.
Initial download of the metrics may take a while.