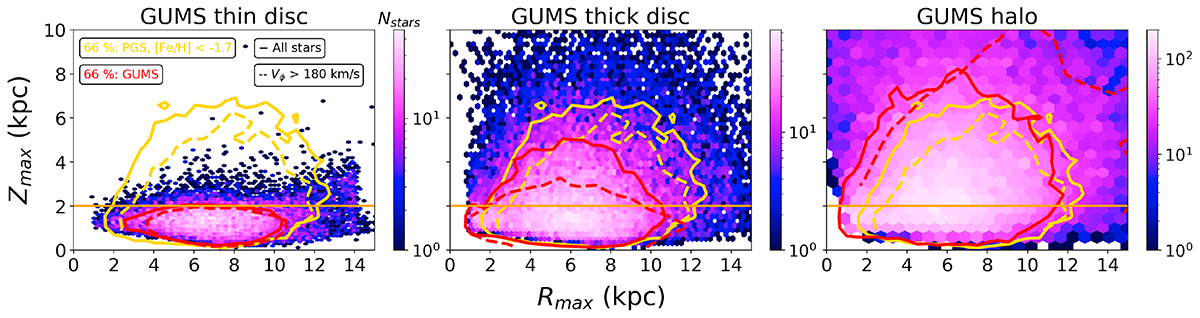
Fig. 13.
Download original image
Zmax as a function of Rmax. The density plot corresponds to GUMS stars that follow the selection function of the PGS VMP sample (below [Fe/H] = –1.7) in ℓ, b, ϖ and apparent G magnitude. The red solid line corresponds to the 66% contour line of each GUMS sample, while the yellow solid line is the 66% contour line of PGS VMP stars ([Fe/H] < –1.7). The red dashed line corresponds to the 66% contour line of each highly prograde (Vϕ > 180 km.s−1) GUMS subsample; the yellow dashed line is the 66% contour line of PGS VMP highly prograde stars. The orange solid horizontal line corresponds to Zmax = 2 kpc. Left panel: GUMS thin disc. Middle panel: GUMS thick disc. Right panel: GUMS halo.
Current usage metrics show cumulative count of Article Views (full-text article views including HTML views, PDF and ePub downloads, according to the available data) and Abstracts Views on Vision4Press platform.
Data correspond to usage on the plateform after 2015. The current usage metrics is available 48-96 hours after online publication and is updated daily on week days.
Initial download of the metrics may take a while.