Open Access
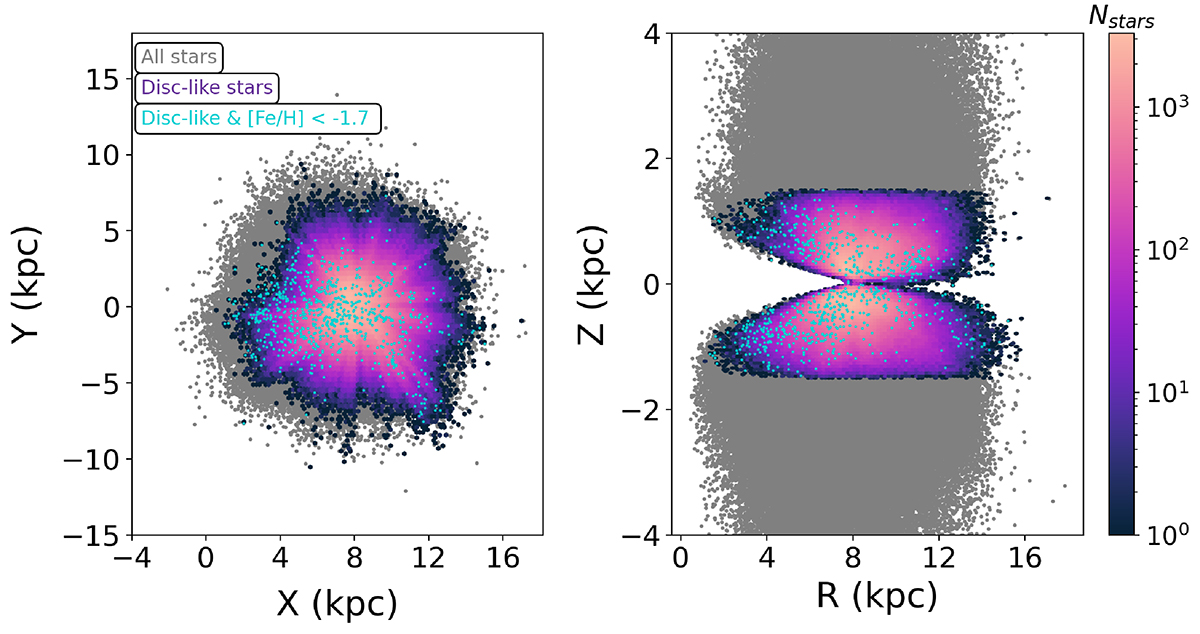
Fig. 12.
Download original image
Spatial distributions. Grey scatter plot: same as in Fig. 2. Density plot: disc-like stars (Vϕ > 180 km.s−1 and Zmax < 1.5 kpc). Teal scatter plot: disc-like VMP stars. Left panel: X versus Y. Right panel: R versus Z.
Current usage metrics show cumulative count of Article Views (full-text article views including HTML views, PDF and ePub downloads, according to the available data) and Abstracts Views on Vision4Press platform.
Data correspond to usage on the plateform after 2015. The current usage metrics is available 48-96 hours after online publication and is updated daily on week days.
Initial download of the metrics may take a while.