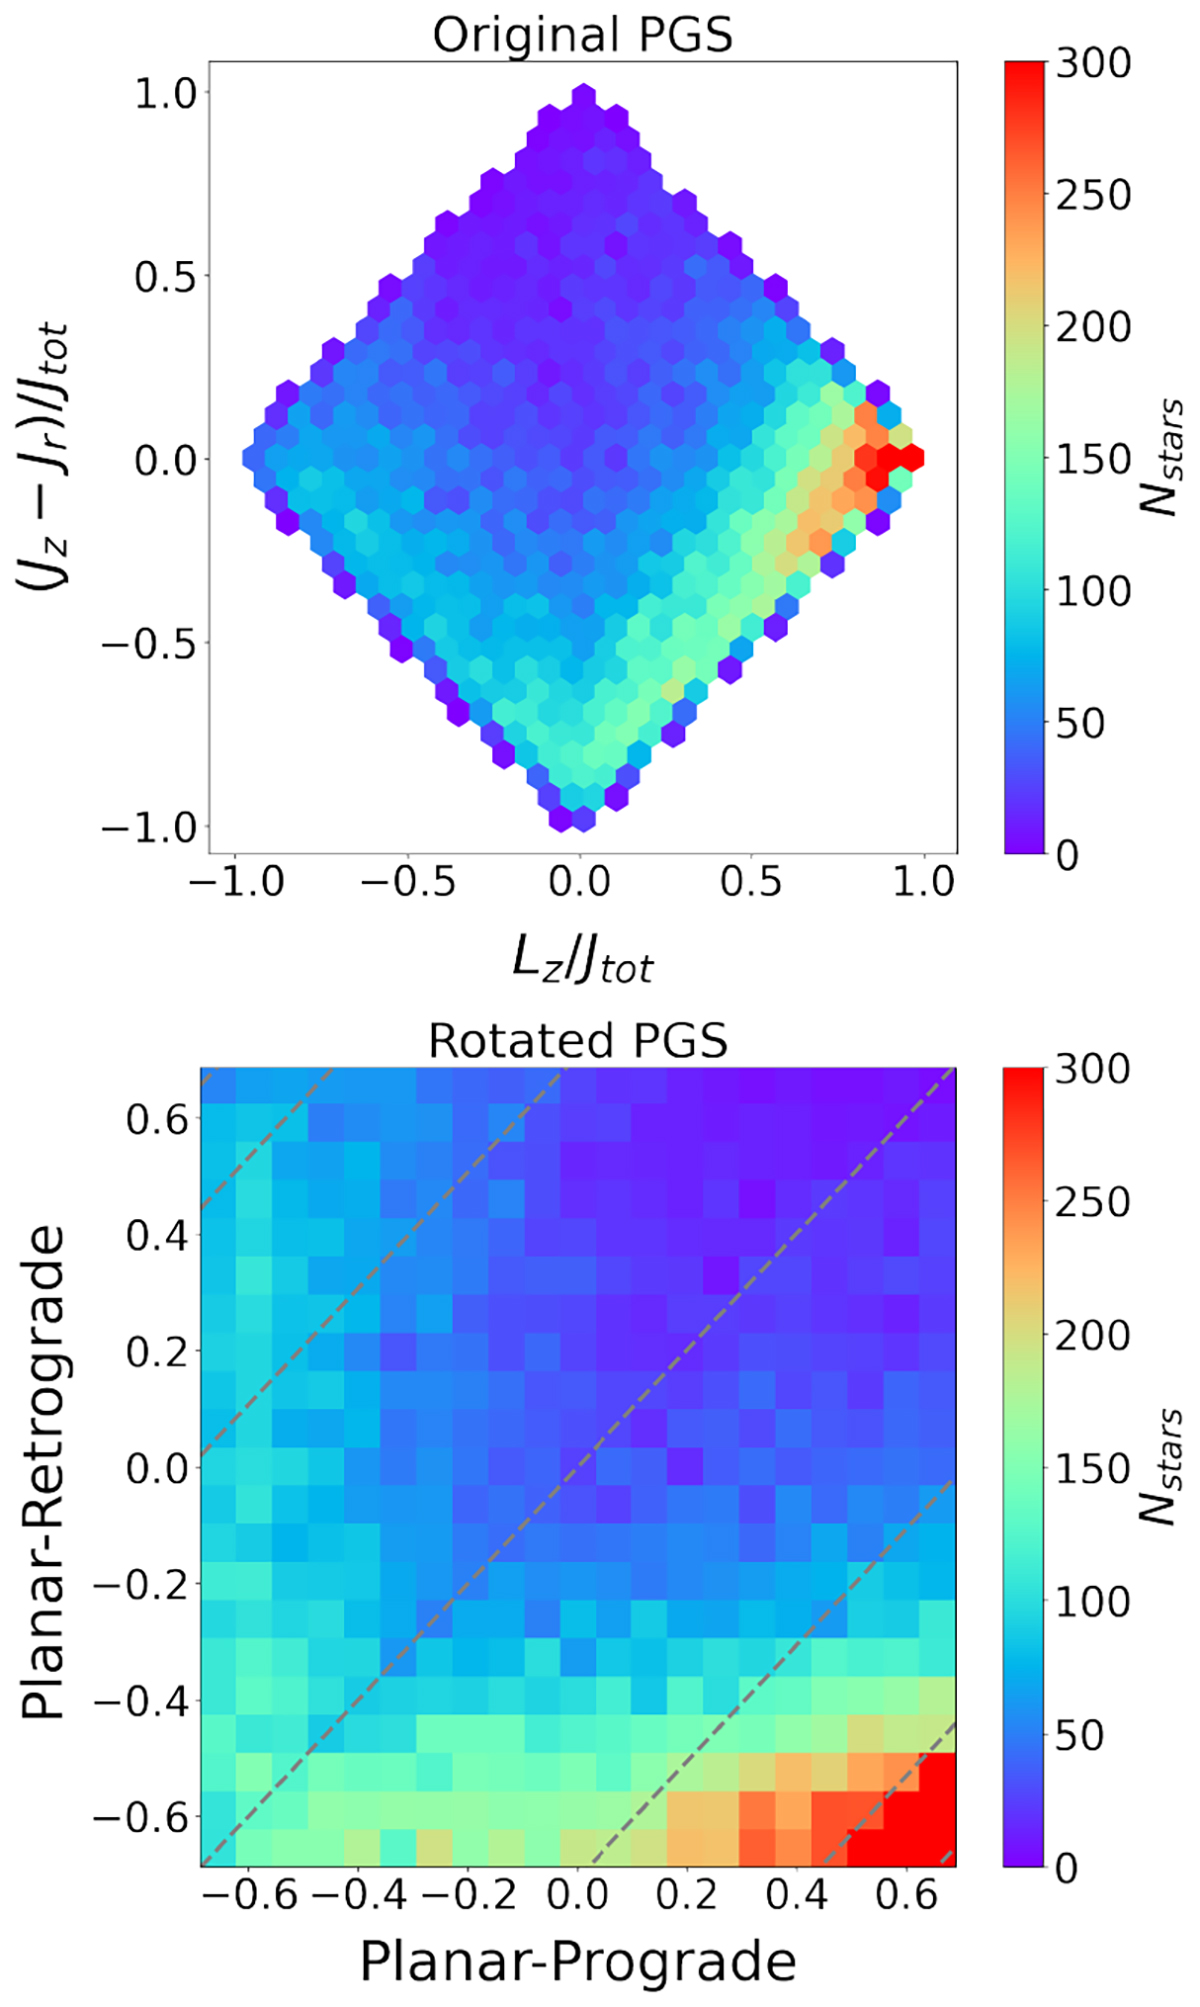
Fig. 10.
Download original image
Densities in the action space. Top: original PGS after applying the isochrone filtering method, in the most metal-poor interval (–4.0 ≤ [Fe/H] < –1.7). Same plot as the right panel of Fig. 7. Bottom: same as the top panel, after rotating the (central) coordinates of each pixel by +45 degrees. The limits of the plot in that space correspond to the rotated coordinates of the four corners of the original action space. The grey dashed lines of the bottom panel correspond to different values of Lz/Jtot: [–0.95, –0.8, –0.5, 0, 0.5, 0.8, 0.95].
Current usage metrics show cumulative count of Article Views (full-text article views including HTML views, PDF and ePub downloads, according to the available data) and Abstracts Views on Vision4Press platform.
Data correspond to usage on the plateform after 2015. The current usage metrics is available 48-96 hours after online publication and is updated daily on week days.
Initial download of the metrics may take a while.