Fig. E.1
Download original image
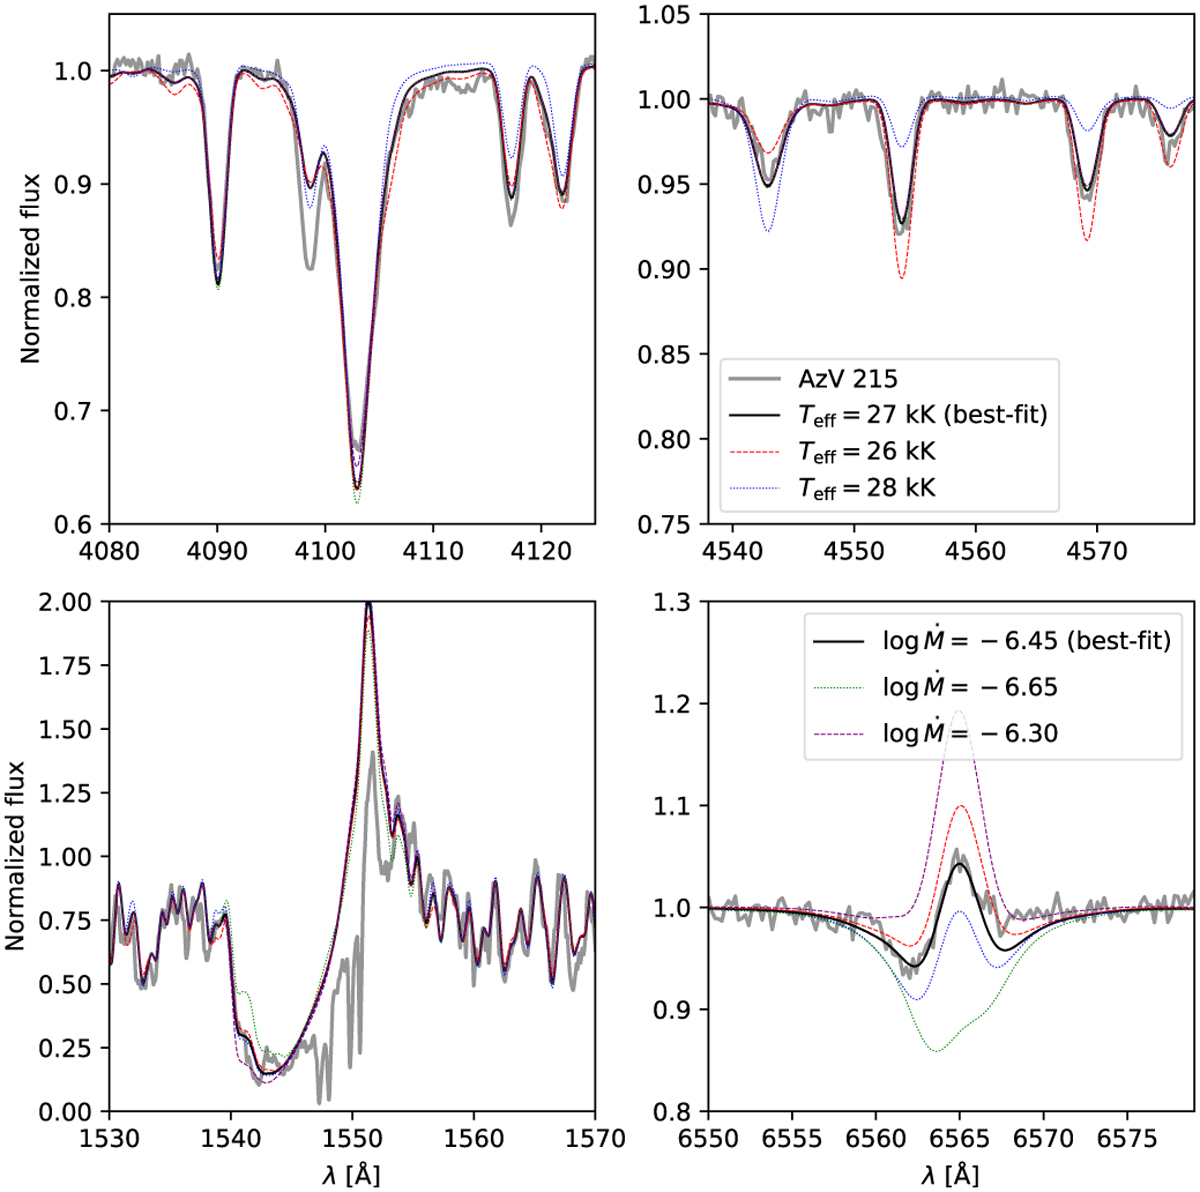
Illustration of the determination of parameters of AzV 215. The solid gray lines are the observed spectra. The black filled line is the best-fit model. The blue dotted(red dashed) line represents a model with higher(lower) temperature. Likewise, the green dotted(purple dashed) line shows models with lower(higher) mass-loss rates.
Current usage metrics show cumulative count of Article Views (full-text article views including HTML views, PDF and ePub downloads, according to the available data) and Abstracts Views on Vision4Press platform.
Data correspond to usage on the plateform after 2015. The current usage metrics is available 48-96 hours after online publication and is updated daily on week days.
Initial download of the metrics may take a while.