Open Access
Fig. D.4
Download original image
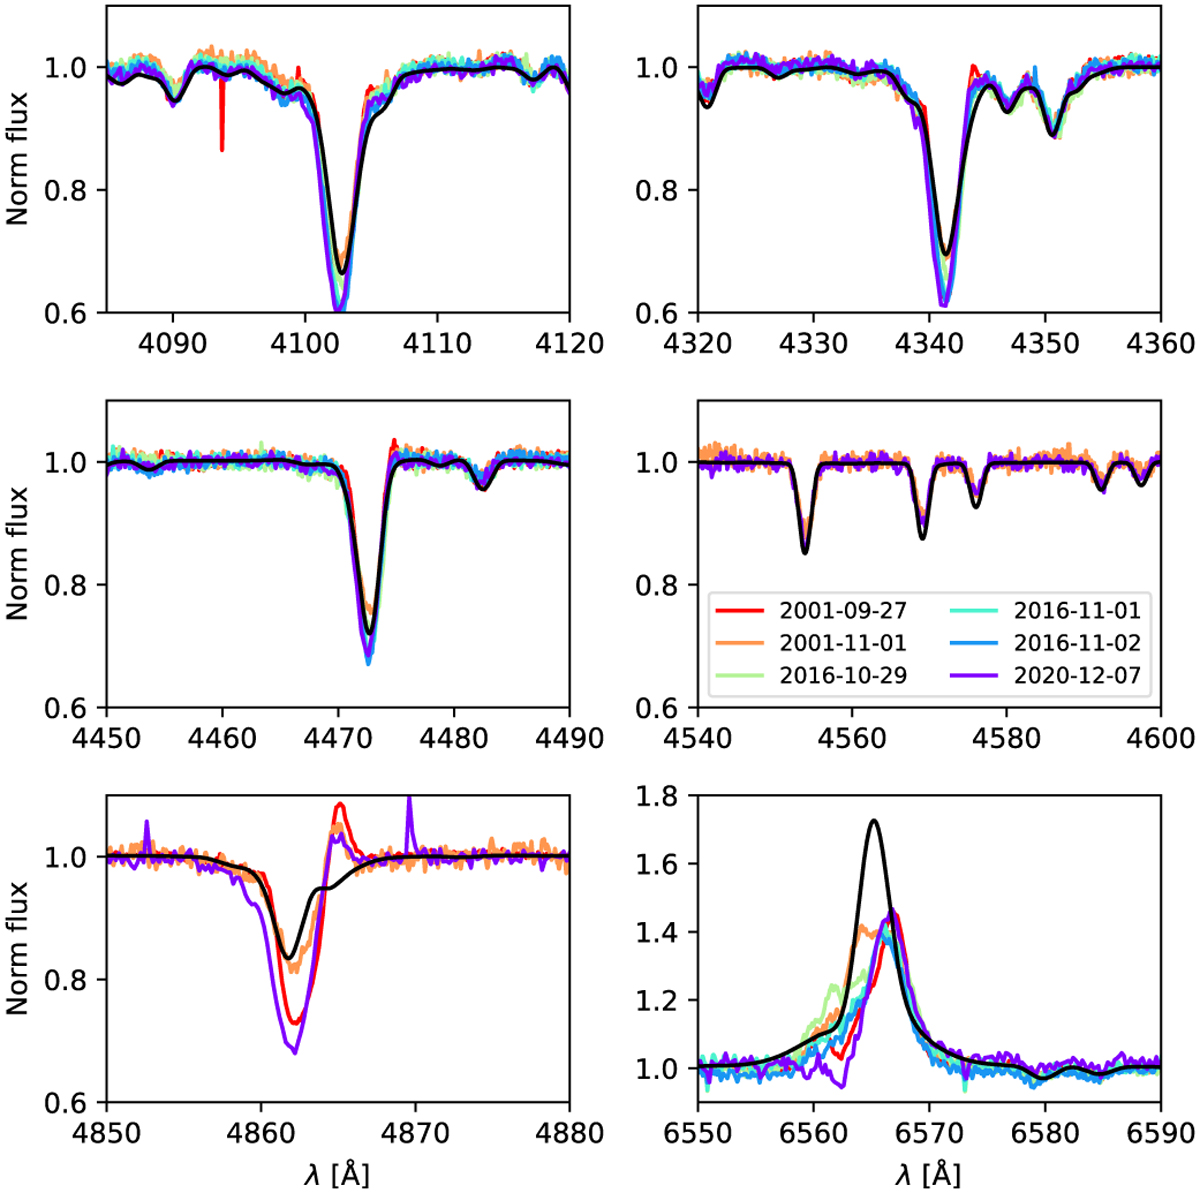
Optical time variability of Sk 191. The figure shows the Balmer lines (upper and lower rows of plots) as well as He I λ4471 and Si III λ4552,67,78 in the middle row.
Current usage metrics show cumulative count of Article Views (full-text article views including HTML views, PDF and ePub downloads, according to the available data) and Abstracts Views on Vision4Press platform.
Data correspond to usage on the plateform after 2015. The current usage metrics is available 48-96 hours after online publication and is updated daily on week days.
Initial download of the metrics may take a while.