Open Access
Fig. D.3
Download original image
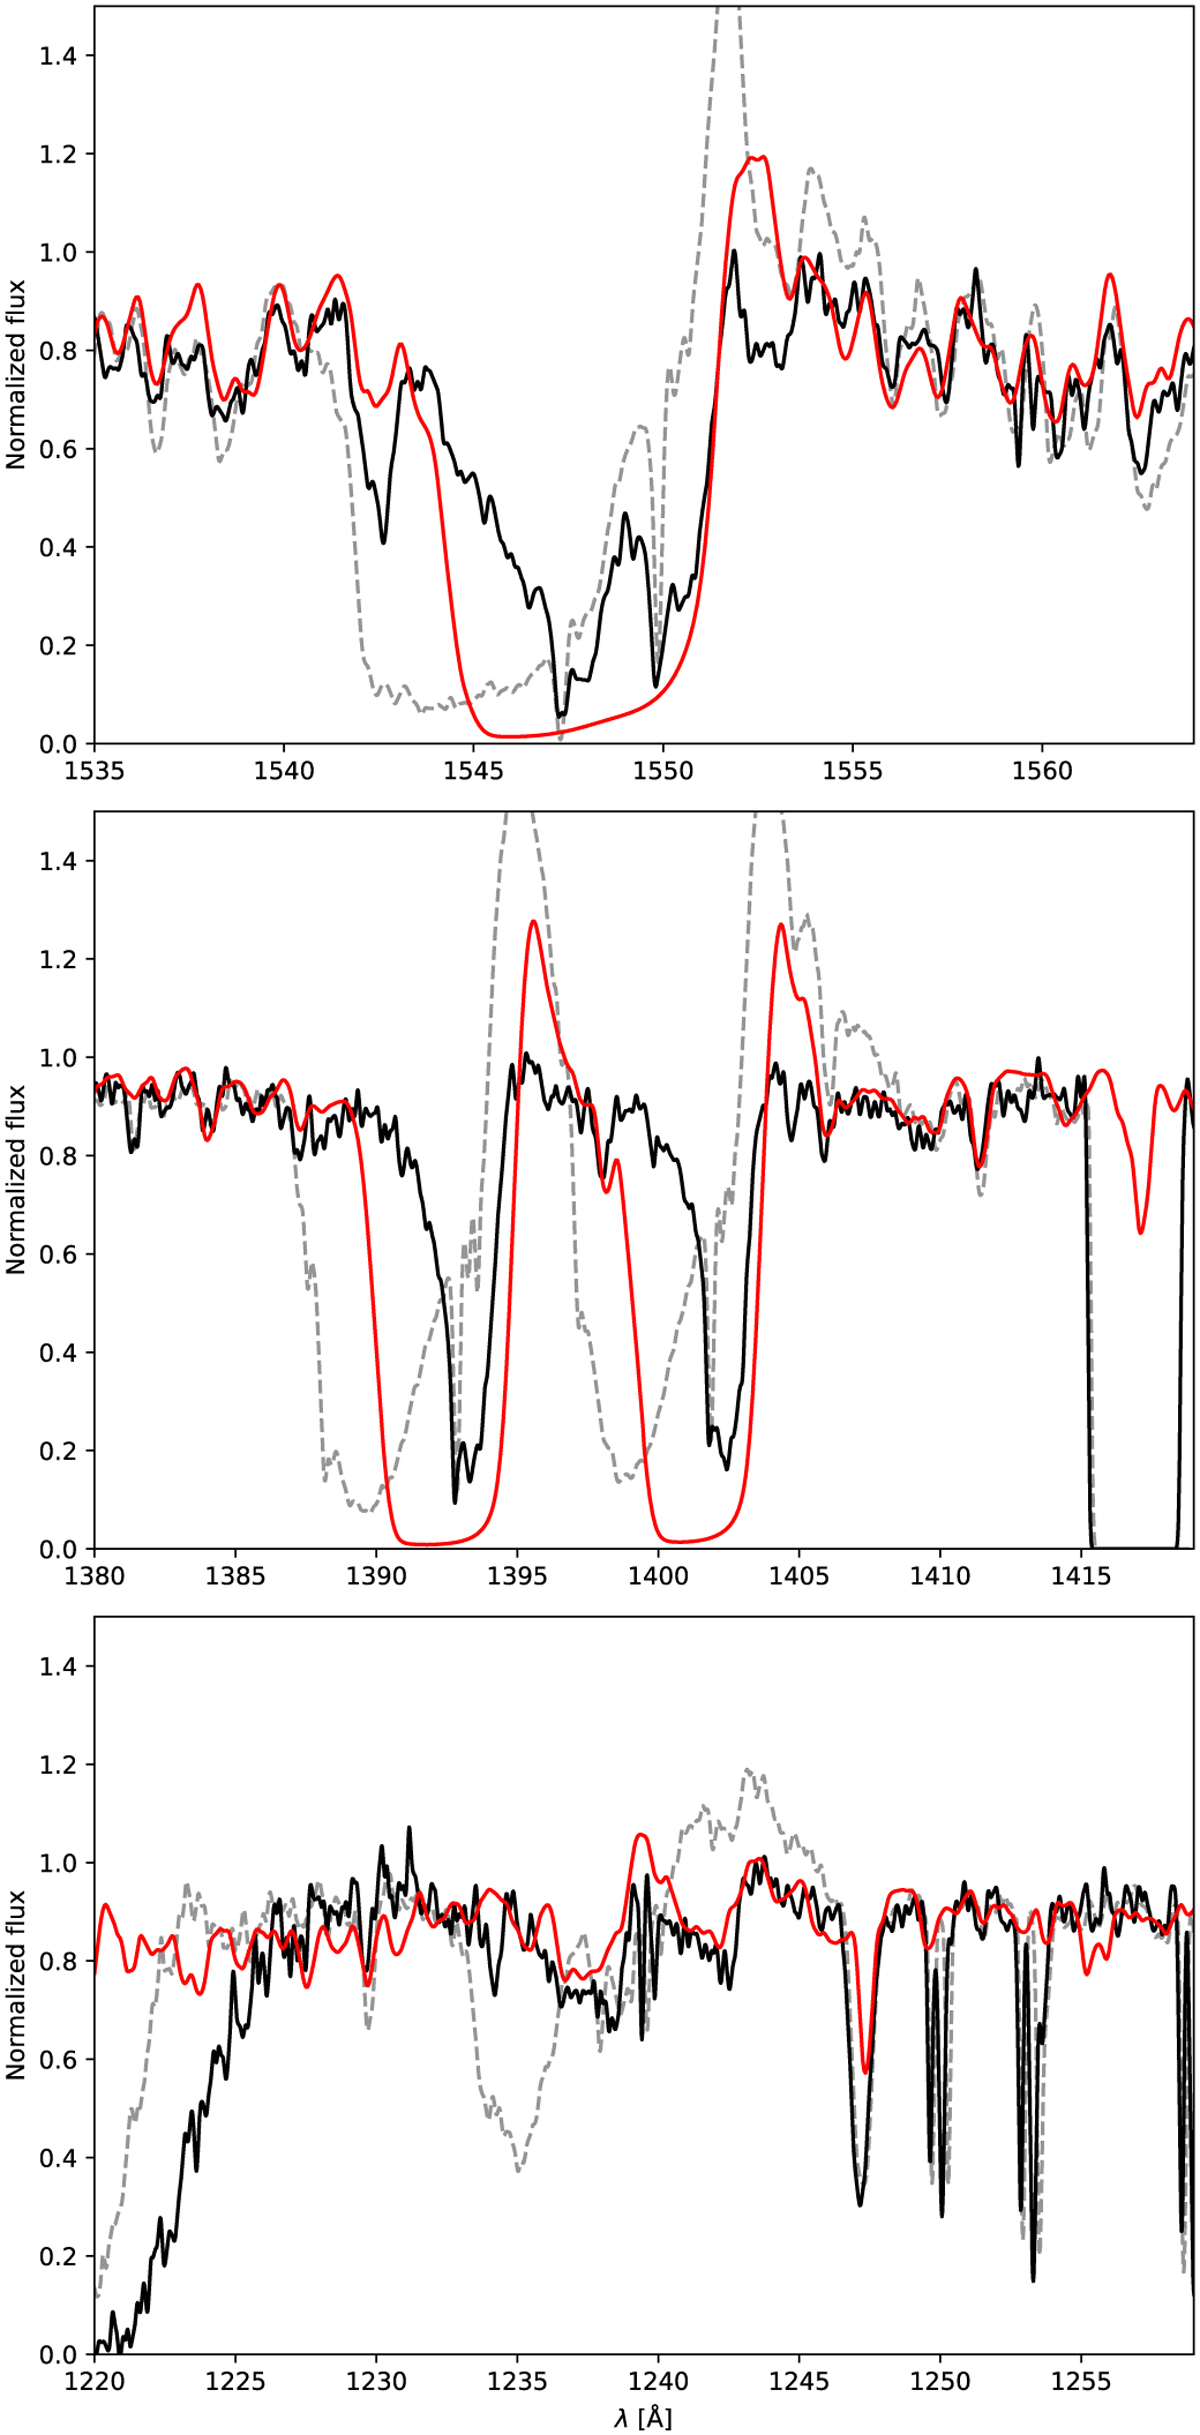
Observed (black line) and model (red line) spectrum of AzV 104 in the regions of N V λ1240, Si IV λ1400, and C IV λ1550. The UV spectrum of AzV 488 is shown as a gray dashed line for comparison.
Current usage metrics show cumulative count of Article Views (full-text article views including HTML views, PDF and ePub downloads, according to the available data) and Abstracts Views on Vision4Press platform.
Data correspond to usage on the plateform after 2015. The current usage metrics is available 48-96 hours after online publication and is updated daily on week days.
Initial download of the metrics may take a while.