Open Access
Fig. D.1
Download original image
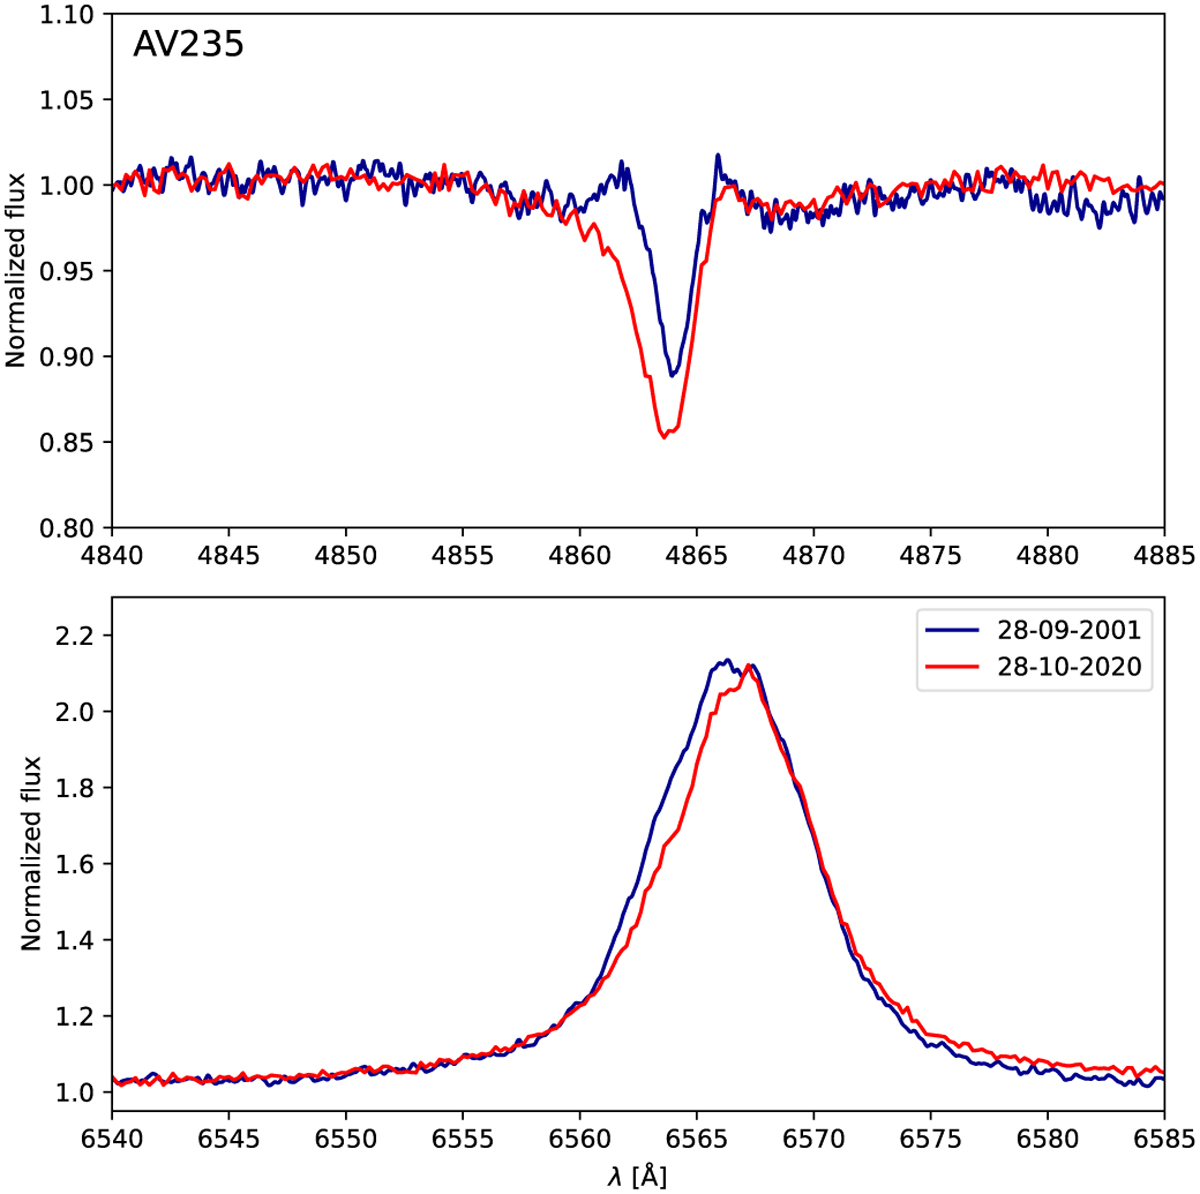
Time variation between 2001 (dark blue line) and 2020 (red line) of the spectrum of AzV 235 in the regions of Hα and Hβ.
Current usage metrics show cumulative count of Article Views (full-text article views including HTML views, PDF and ePub downloads, according to the available data) and Abstracts Views on Vision4Press platform.
Data correspond to usage on the plateform after 2015. The current usage metrics is available 48-96 hours after online publication and is updated daily on week days.
Initial download of the metrics may take a while.