Open Access
Fig. 2
Download original image
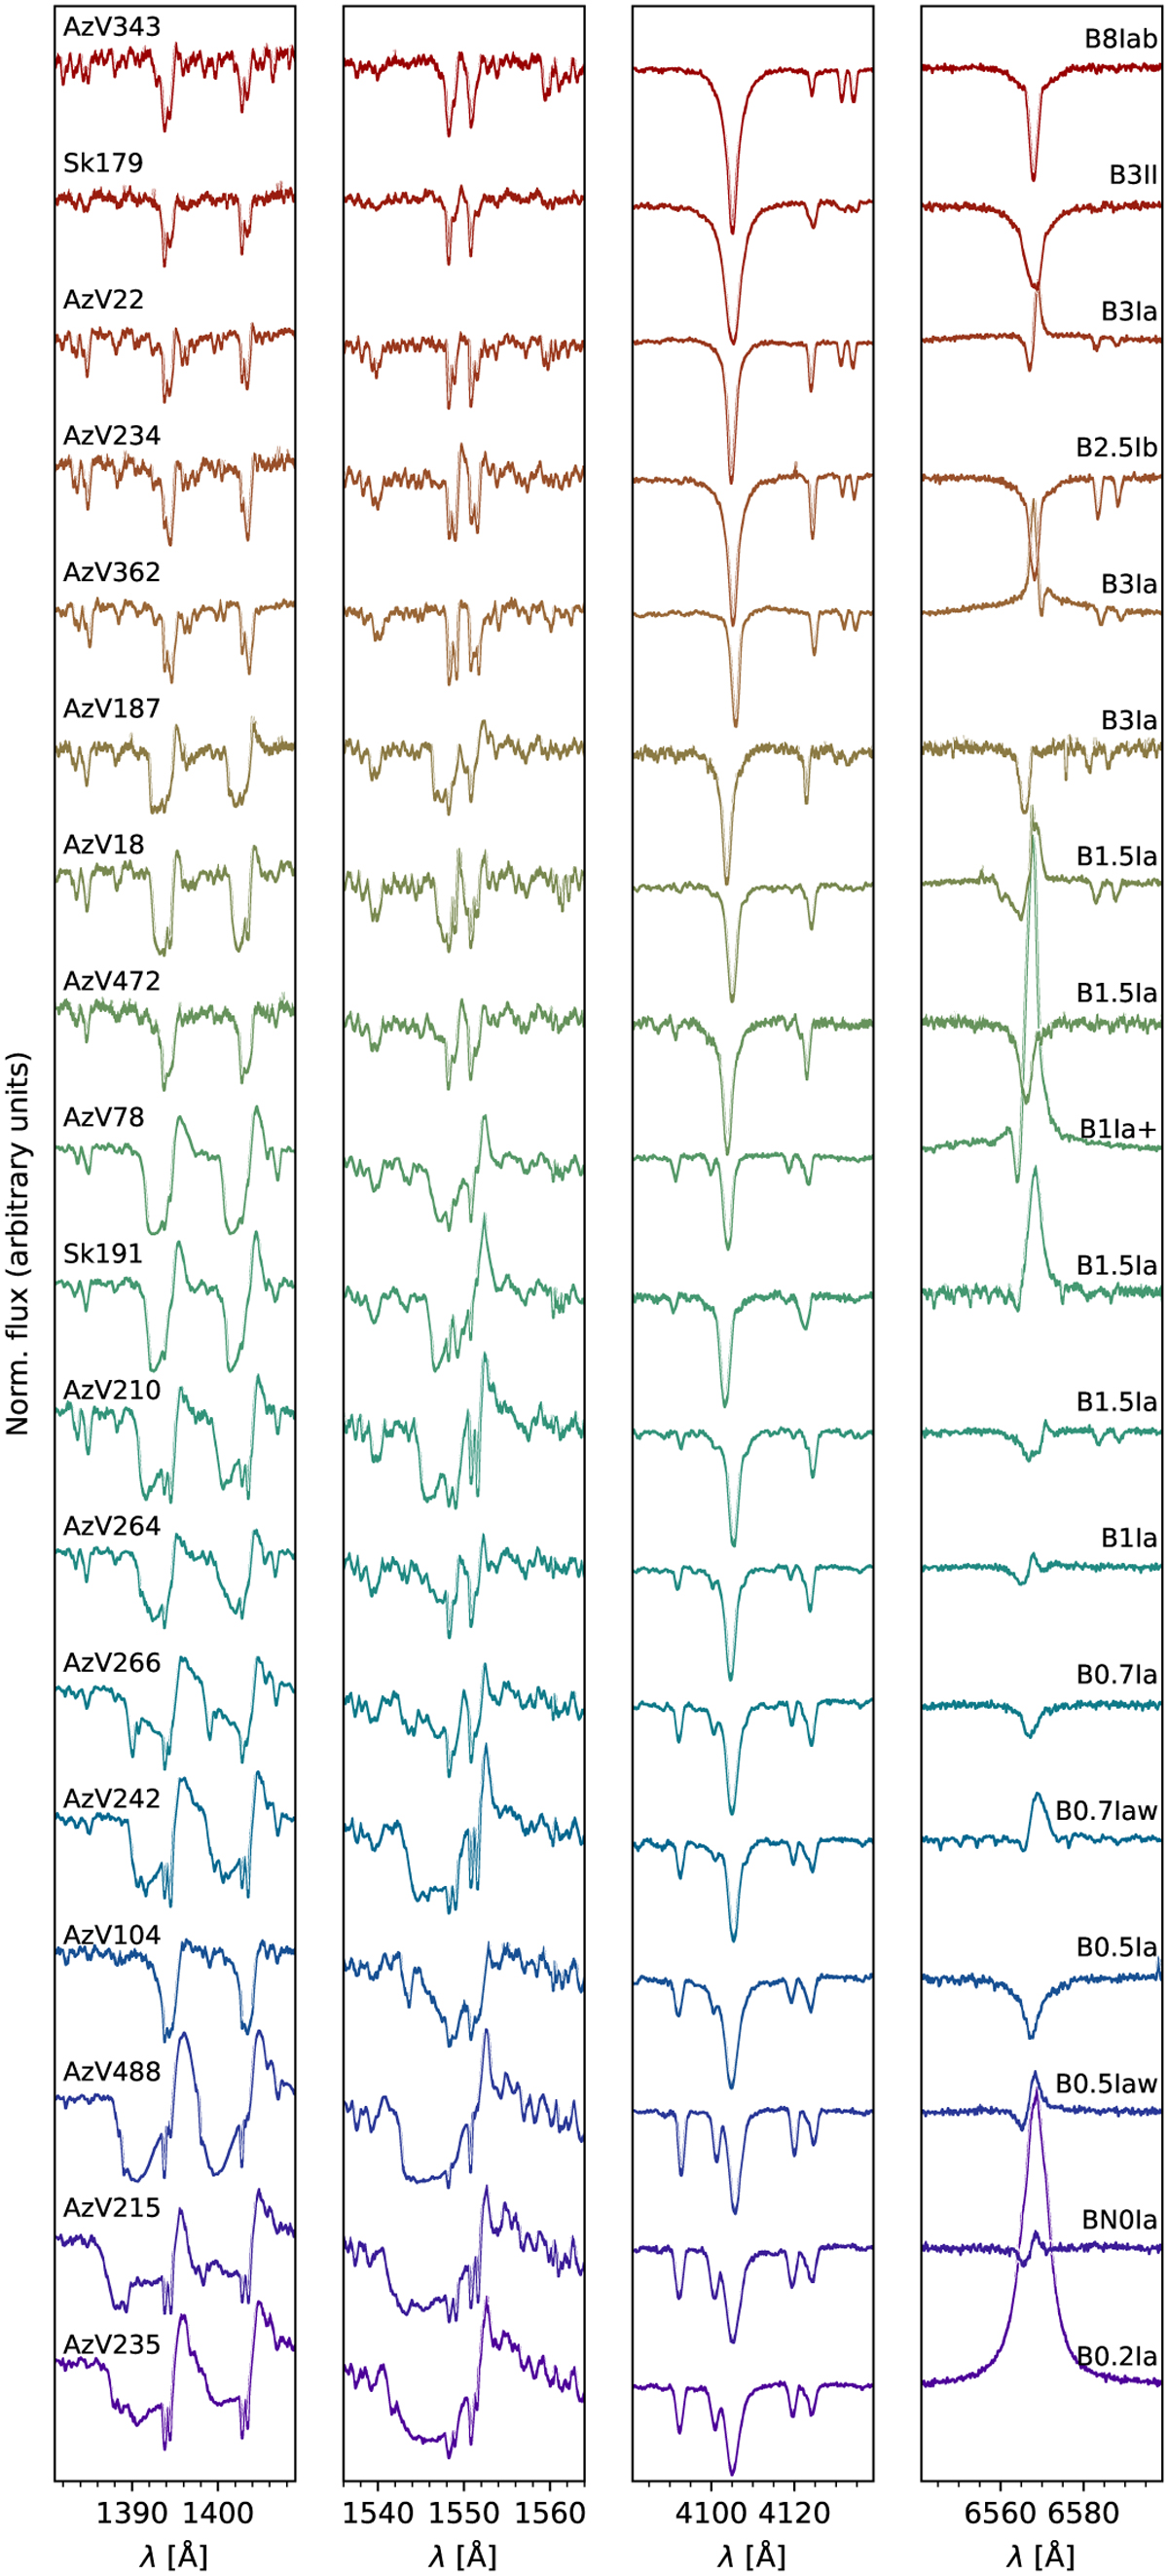
UV and optical spectra used to derive stellar parameters of the sample stars. This figure illustrates the variation in some spectral features with the spectral type. From left to right, the columns show spectral regions around Si IV λ1400, C IV λ1550, O+N+Hδ+He I+Si lines, and Hα+C II.
Current usage metrics show cumulative count of Article Views (full-text article views including HTML views, PDF and ePub downloads, according to the available data) and Abstracts Views on Vision4Press platform.
Data correspond to usage on the plateform after 2015. The current usage metrics is available 48-96 hours after online publication and is updated daily on week days.
Initial download of the metrics may take a while.