Fig. 18
Download original image
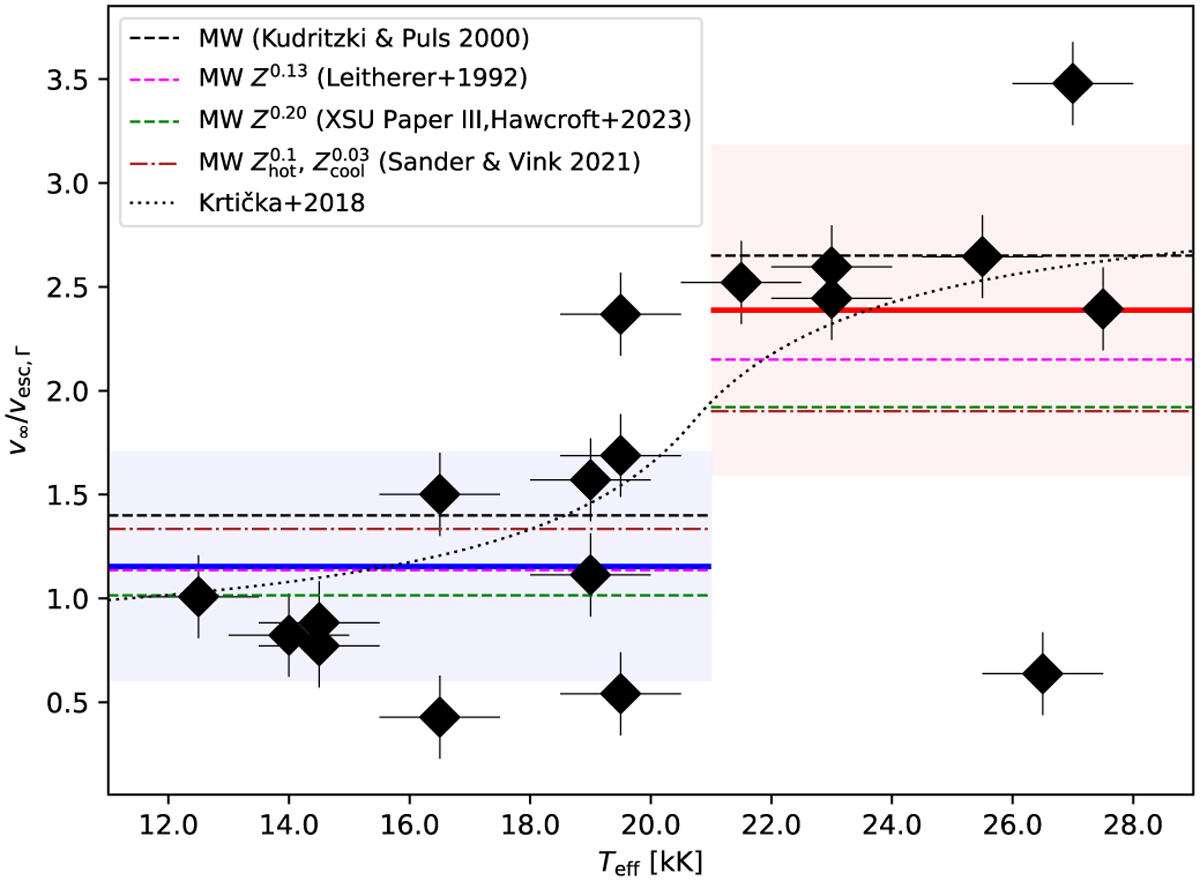
Escape-normalized terminal velocity vs. effective temperature. The dashed black lines are the relation presented by Kudritzki & Puls (2000) compiling previous data. The dot-dashed line is the relation presented by Krtička et al. (2021). The red and blue thick solid lines are the average value of our determinations and their respective shaded regions are the standard deviation. The thin dashed fuchsia lines are the Kudritzki & Puls (2000) relation scaled by (Z/Z⊙)0.1 metallicity dependence from Leitherer et al. (1992) and the thin dashed green line below it is the metallicity scaling found by Hawcroft et al. (2024). The brown horizontal lines indicate the velocity scaling proposed by Vink & Sander (2021).
Current usage metrics show cumulative count of Article Views (full-text article views including HTML views, PDF and ePub downloads, according to the available data) and Abstracts Views on Vision4Press platform.
Data correspond to usage on the plateform after 2015. The current usage metrics is available 48-96 hours after online publication and is updated daily on week days.
Initial download of the metrics may take a while.