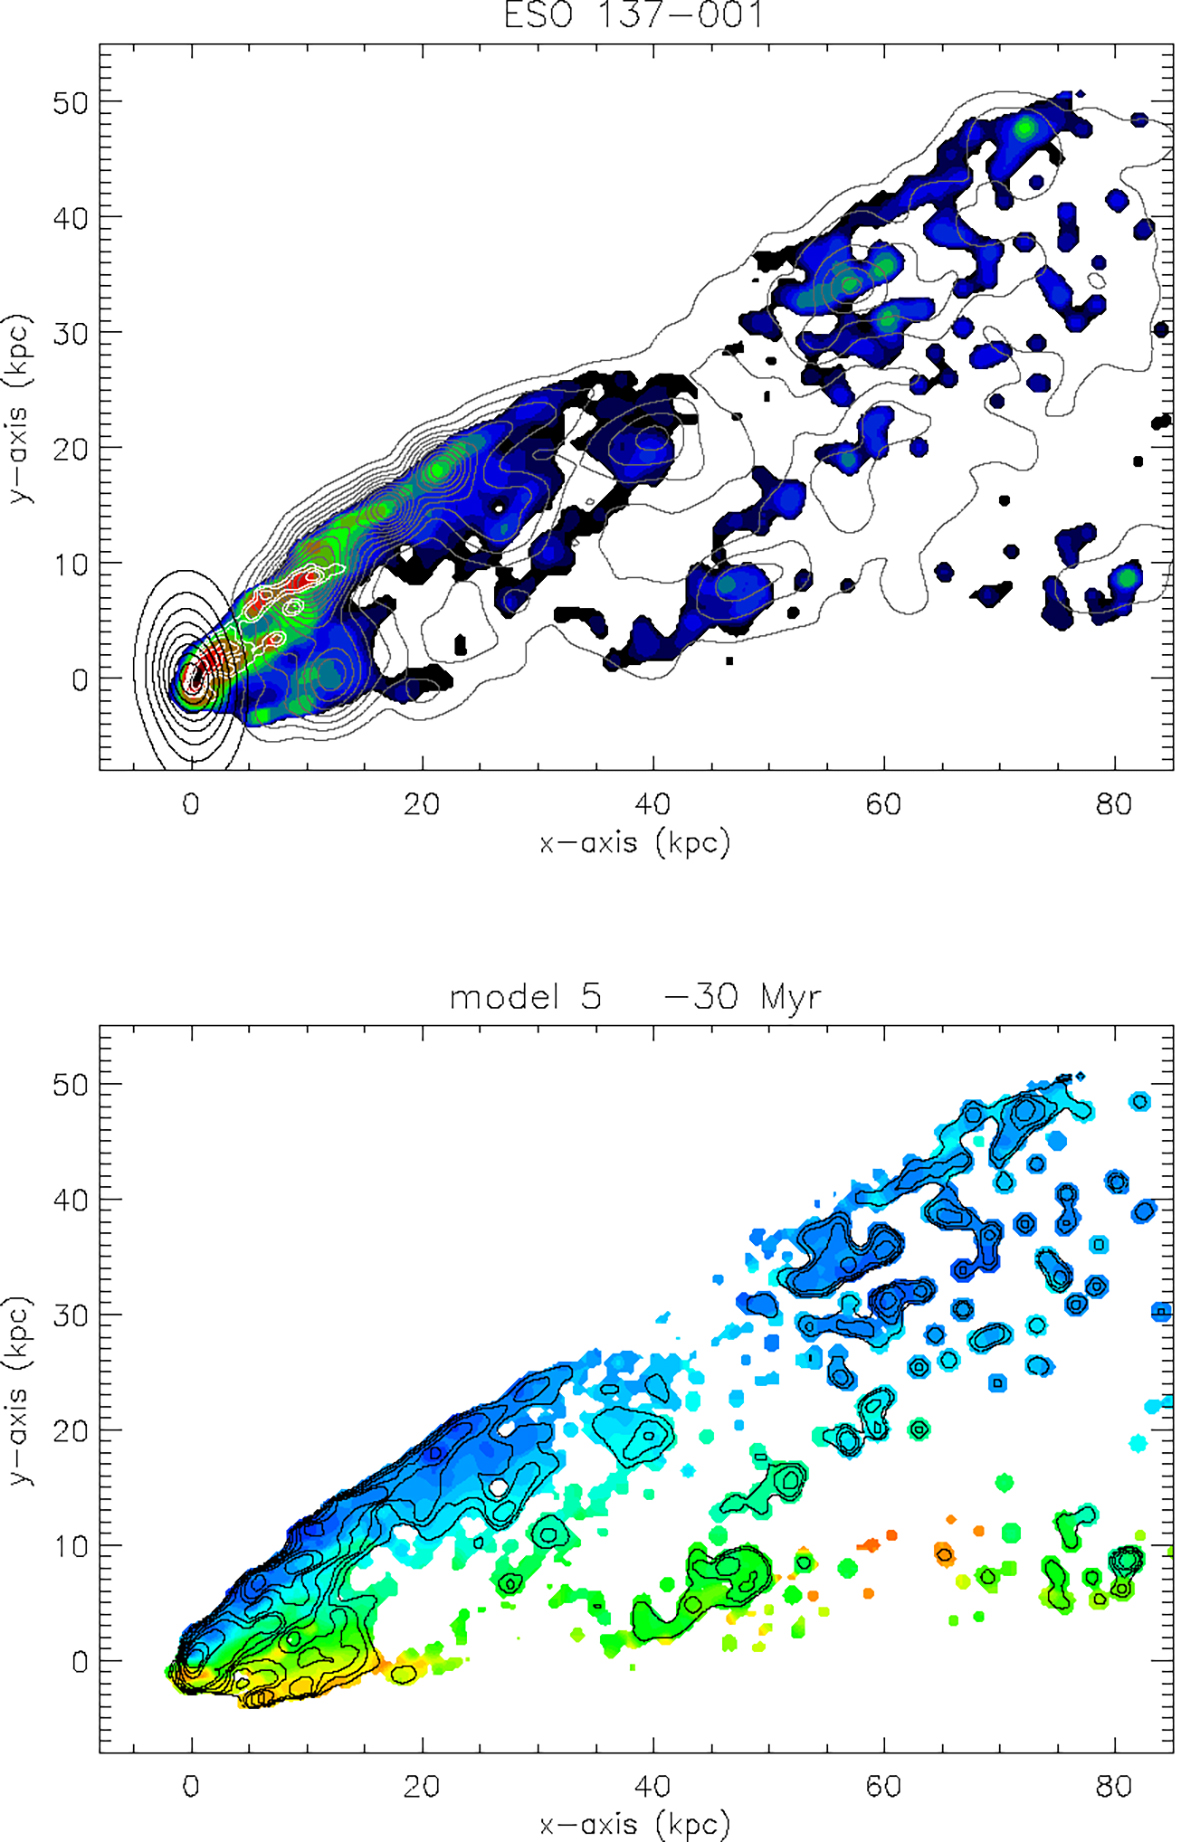
Fig. 5.
Download original image
Highest-ranked model A of ESO 137−001. Upper panel: Hα is shown in color; X-ray in dark gray contours; CO in white contours; and stellar content in black contours. The relative contours are the same as in Fig. 4, i.e., Hα: logarithmic transfer function with 15 contour levels; X-ray and CO: square root transfer function with 15 contour levels. Lower panel: Hα velocity field. The colors are the same as in Fig. 4. The corresponding time evolution and that of the mass surface densities of the different gas phases can be found be found in online movies.
Current usage metrics show cumulative count of Article Views (full-text article views including HTML views, PDF and ePub downloads, according to the available data) and Abstracts Views on Vision4Press platform.
Data correspond to usage on the plateform after 2015. The current usage metrics is available 48-96 hours after online publication and is updated daily on week days.
Initial download of the metrics may take a while.