Fig. 2.
Download original image
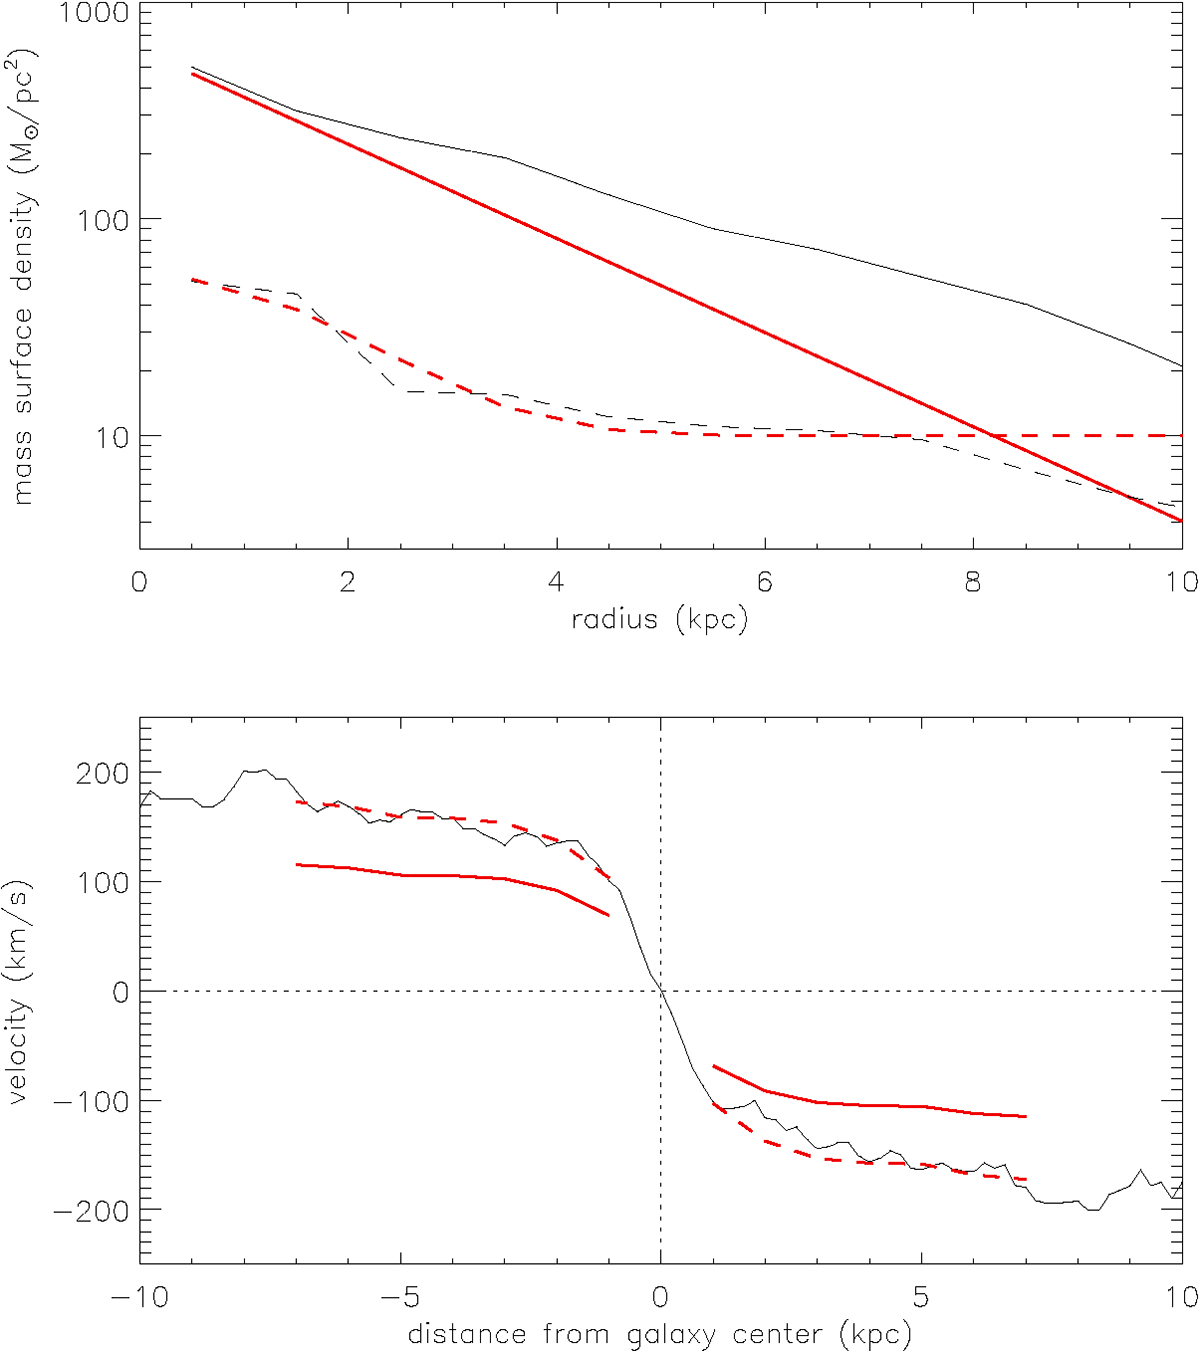
Initial model conditions. Upper panel: Model stellar- (black solid line) and gas-mass (black dashed line) surface density profiles. Solid red line: Exponential stellar-mass surface density profile with a scale length of 2 kpc. Dashed red line: Analytical approximation to the gas surface density profile (see text). Lower panel: Model (black solid line) and observed asymmetric-drift-corrected (red line; Luo et al. 2023) rotation curve. Red dashed line: Observed rotation curve multiplied by a factor of 1.5.
Current usage metrics show cumulative count of Article Views (full-text article views including HTML views, PDF and ePub downloads, according to the available data) and Abstracts Views on Vision4Press platform.
Data correspond to usage on the plateform after 2015. The current usage metrics is available 48-96 hours after online publication and is updated daily on week days.
Initial download of the metrics may take a while.